Ocean Observing System
Report Card 2019

Joint Technical Commission for Oceanography and Marine Meteorology (JCOMM) of the World Meteorological Organization (WMO) and UNESCO’s Intergovernmental Oceanographic Commission (IOC)

OCEAN ACIDIFICATION

Ocean carbon uptake and acidification

Anthropogenic carbon dioxide (CO2) emissions have substantially increased atmospheric CO2 concentrations over the last two centuries. Uptake of CO2 by the ocean mitigates the effects of climate change. Observations show that this CO2 causes changes in seawater chemistry, including decreases in seawater pH known as ocean acidification. This process, detrimental to sea life and ocean services, needs to be constantly monitored through sustained ocean observations, in order to develop meaningful projections of future

impacts on marine ecosystems, and to implement effective long-term mitigation and adaptation strategies. Ocean acidification has been recognized as vital to sustainable development by the United Nations and the Sustainable Development Goal (SDG) 14(1) and its indicator 14.3.1(2). Under the custodianship of the Intergovernmental Oceanographic Commission (IOC) of UNESCO, this indicator mandates measurement of average marine acidity (pH) at representative sampling sites globally.

Atmospheric CO2, shown in red, measured at Mauna Loa, Hawaii. Seawater pCO2 (green) and pH values (blue) are
from the ocean to the north of Hawaii (Station Aloha). As CO2 is absorbed by the ocean, the water becomes more
acidic (the pH declines). Adapted from: Dore et al. 2009. PNAS 106:12235-12240.

Ocean acidification is identified by climate scientists as a Global Climate Indicator - one of a set of climate parameters used to provide key information on climate change. Several JCOMM networks, such as ship based oceanographic measurements, multidisciplinary moorings, autonomous profiling floats and gliders, provide in situ ocean carbonate chemistry measurements, helping to sustain and expand global ocean acidification observations.

Ocean acidification observations, following agreed guidelines and best practices, are used by numerous communities, including the Global Ocean Acidification-Observing Network (GOA-ON)(3) and its intergovernmental and international partners(4), to measure changes and indicate trends in the ocean carbon uptake.

Coordinated and continuous monitoring of the global changes in ocean chemistry enable nations to report on the ocean acidification Global Climate Indicator, as well as the United Nations SDG target 14.3.(5)

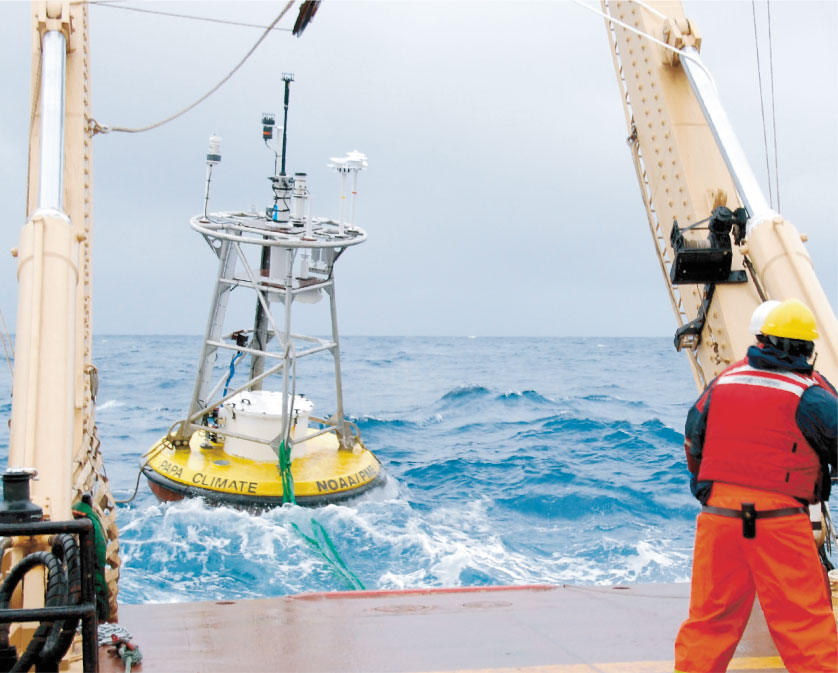
Surface element of a long-term, deep-sea mooring, equipped with pH and other CO2 relevant sensors,
deployed in the North Pacific Ocean. Dr M. Cronin, PMEL NOAA.

(1) SDG 14 https://sustainabledevelopment.un.org/sdg14

(2) SDG 14.3.1 indicator methodology http://goa-on.org/resources/sdg_14.3.1_indicator.php

(3) GOA-ON: http://goa-on.org

(4) IOC-UNESCO, the International Ocean Carbon Coordination Project (IOCCP), the Ocean Acidification International Coordination Centre (OA-ICC) of the International Atomic Energy Agency (IAEA) and others

(5) SDG Target 14.3: Minimize and address the impacts of ocean acidification, including through enhanced scientific cooperation at all levels.

PARTNERSHIPS

Scientific collaborations

The Argo program exemplifies international collaboration on a scale rarely seen in the scientific community. In 2018, Argo reached 4,000 floats worldwide and achieved a major milestone delivering its two millionth profile of temperature and salinity, from the upper two kilometers of the world’s ocean. International collaborative projects are underway to test floats that can descend to a depth of 6,000 meters, expand further into seasonally ice-covered seas, and measure biogeochemical variables.

The Argo vision for a global full-depth and multidisciplinary array will enable a new range of forecasting capabilities, fundamental ocean research, climate assessments, blue economy benefits, and educational engagement. A global implementation of a refreshed Argo design by 2030 will require an even stronger set of national commitments and international community engagement, together with coastal states' continued political support for facilitating observations in their maritime zones.

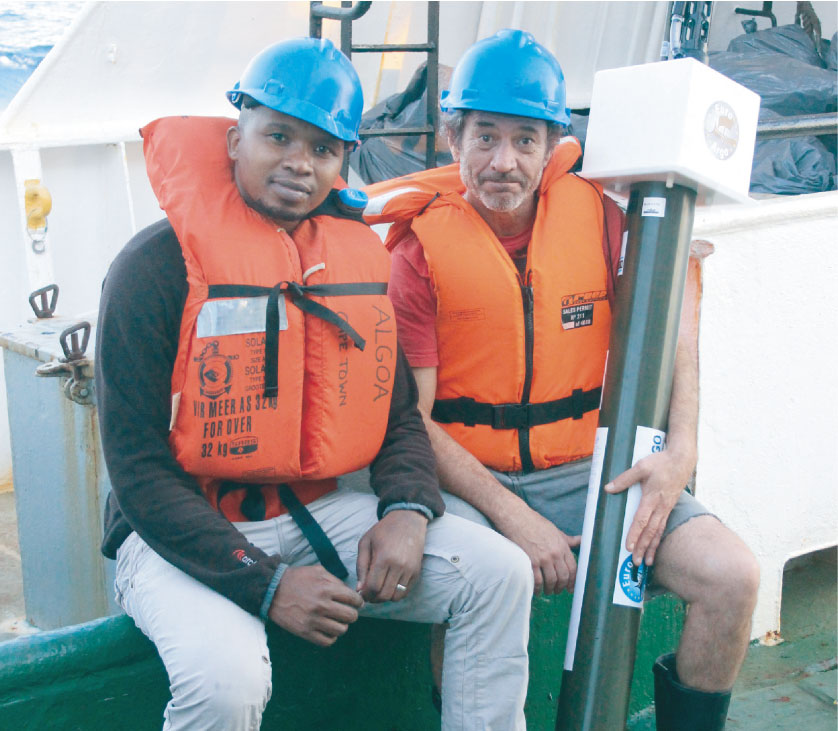
European float deployed by a team of scientists from the South African Department of Environmental Affairs
on board the Research Ship Algoa. Dr T. Lamont, South African Department of Environmental Affairs.

Private sector and citizens involvement

In 2018, an international group of meteorologists, oceanographers and skippers of racing yachts teamed up during the Volvo Ocean Race to use their vessels as “sailing ships of opportunity”, to gather meteorological data and to deploy drifting buoys at sea. In addition, information on the global spread of microplastic pollution was gained. The data collected by these sampling efforts were shared with international open-source databases.

Such partnerships allow citizens to support ocean observations and science, filling critical observational gaps in very remote areas which would be otherwise difficult and very costly for scientific surveys to reach.

Through a vast range of communication channels, these activities are also powerful platforms for raising public awareness of the state of the ocean’s health and the impact of human actions on the ocean.

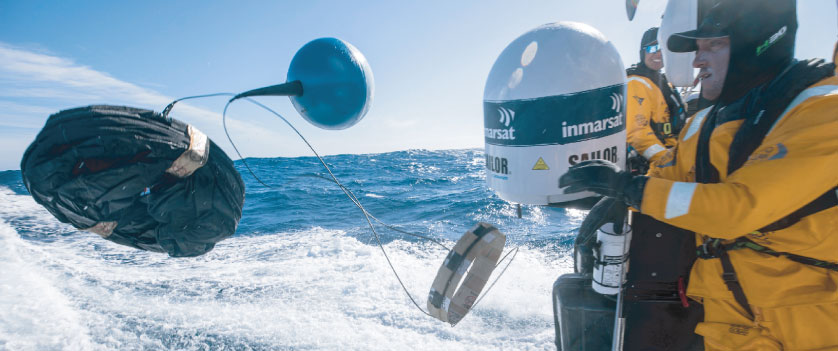
Sailing from Auckland to Itajai, a sailor deployed a surface drifting
buoy during the Volvo Ocean Race 2018. Sam Greenfield, Volvo Ocean Race.

IN SITU AND SATELLITE
OBSERVING SYSTEM STATUS

In 2018, extreme weather and climate events affected about 62 million people with many parts of the globe impacted by climate change. The current increase of carbon dioxide levels in the atmosphere is having a significant impact on temperatures, with 2015-2018 having been confirmed as the four warmest years on record and with an unprecedented increase in ocean acidity which is impacting a number of commercial fisheries.

With the current and increasingly urgent need for nations to take decisions related to the impact of climate change, the Ocean Observing System Report Card 2019 provides insight into the status of the global ocean observing system and highlights the need for sustained ocean monitoring.

The global ocean observing system networks are also fundamental in providing critical data to nations for delivering marine weather and ocean services, to ensure safe and efficient maritime operations, and improving

emergency response efficiency for extreme events. They are also crucial for providing scientific assessments to enable environmental prediction and adaptation to climate change, as well as leading to more effective protection of ecosystems. To better meet expanding societal needs, the global ocean observing system is introducing new technologies and improved capabilities. These advancements will provide more observational information in real-time and long duration high-quality data needed for detection of ocean change, as well as help to address the lack of data in poorly sampled regions.

The sustained ocean observing networks are internationally coordinated by the Joint WMO-IOC Technical Commission for Oceanography and Marine Meteorology (JCOMM), under the Observation Coordination Group. JCOMM works across oceanographic and marine meteorological communities for observations, data management and services, in order to maximize value and impact for local, regional and global societal issues.

2018: ocean observations by the numbers

86

countries involved in ocean observations

8,933
in situ ocean observing platforms and…

18 Ocean and 9 Atmosphere Essential Climate Variables (ECVs)(1) observed

170
satellites continuously monitor the global ocean and atmosphere

2

million Temperature and Salinity profiles acquired in 20 years by the Argo program - a historical record!

THOUSANDS OF SCIENTIFIC PAPERS based on ocean observations are published every year - adding to our knowledge and supporting societal decisions

HUNDREDS OF THOUSANDS OF WEATHER FORECASTS issued annually by meteorological agencies that have assimilated in situ ocean observations to initialize and improve numerical model forecasts

US$

1,5trillion/year

the estimated ocean economy - this will double, to 3 trillion, by 2030 (2). Ocean observations help understand the ocean and why it is changing

(1) ECVs: https://gcos.wmo.int/en/essential-climate-variables/ecv-factsheets

(2) OECD (2016), The Ocean Economy in 2030, OECD Publishing, Paris. http://dx.doi.org/10.1787/9789264251724-en

Ship Observations Team Chair Darin Figurskey learning about the scope of forecast and warning operations at the Indonesian National Weather Forecast Service (BMKG) in Jakarta.

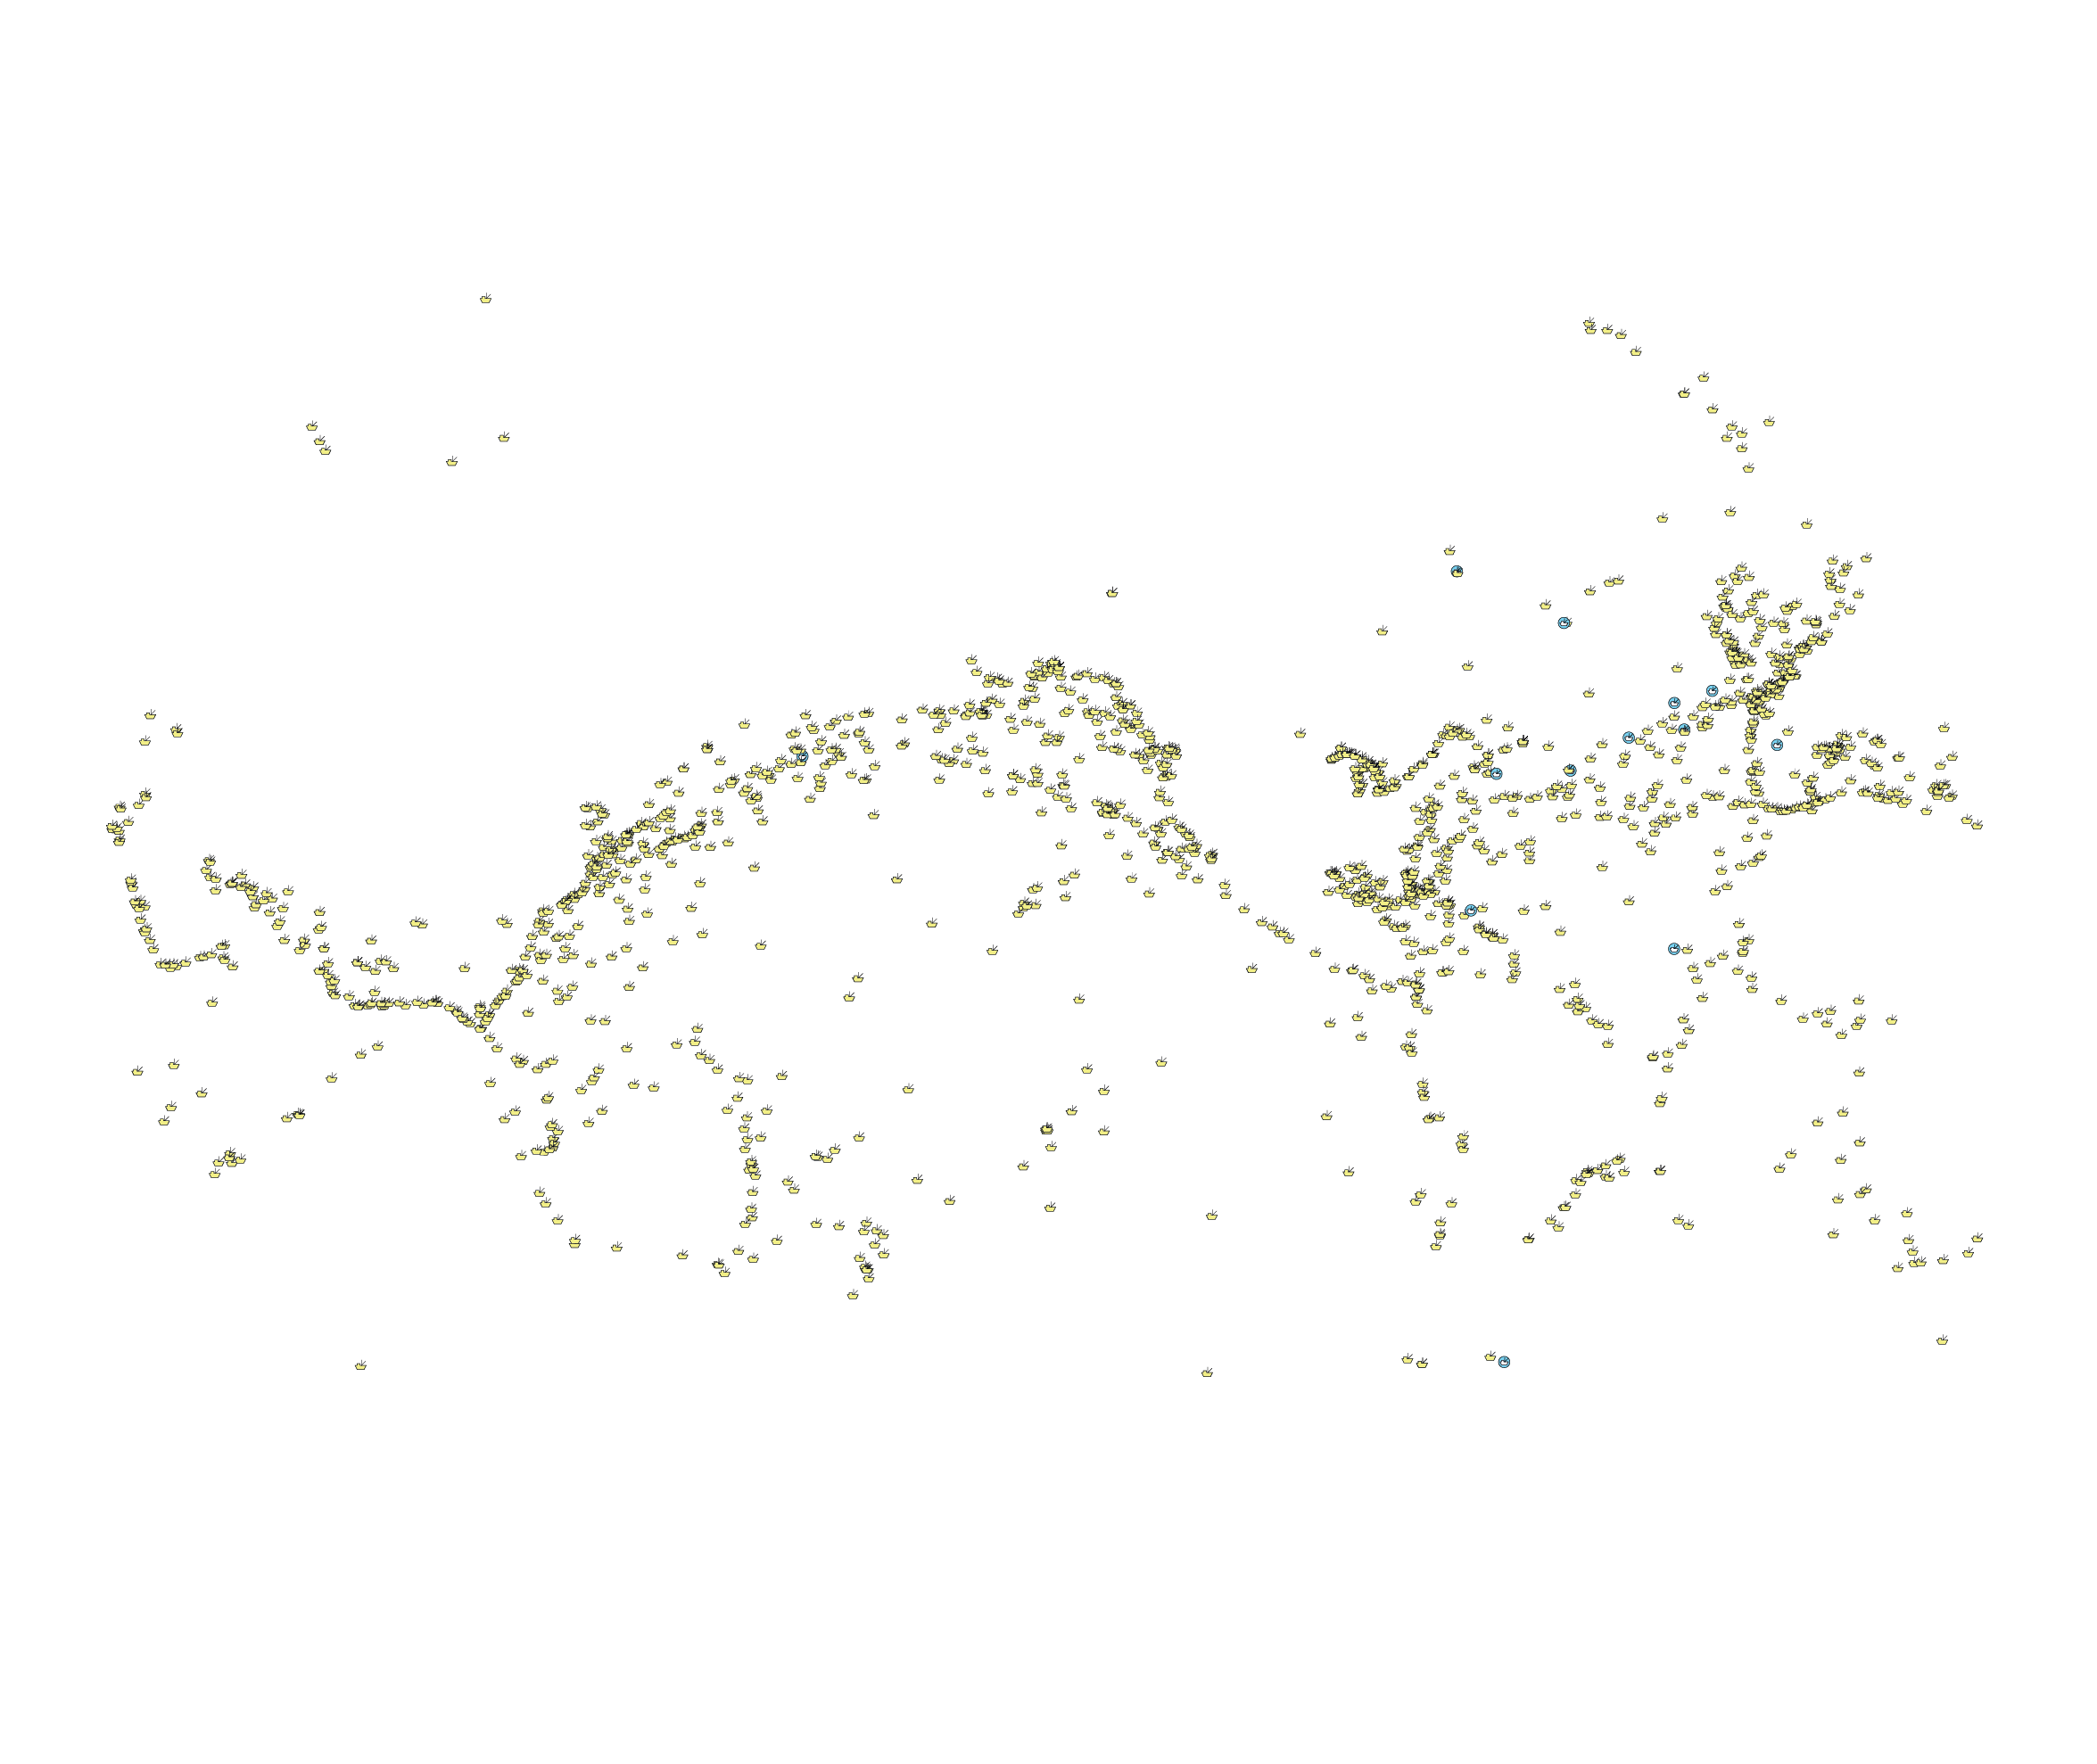
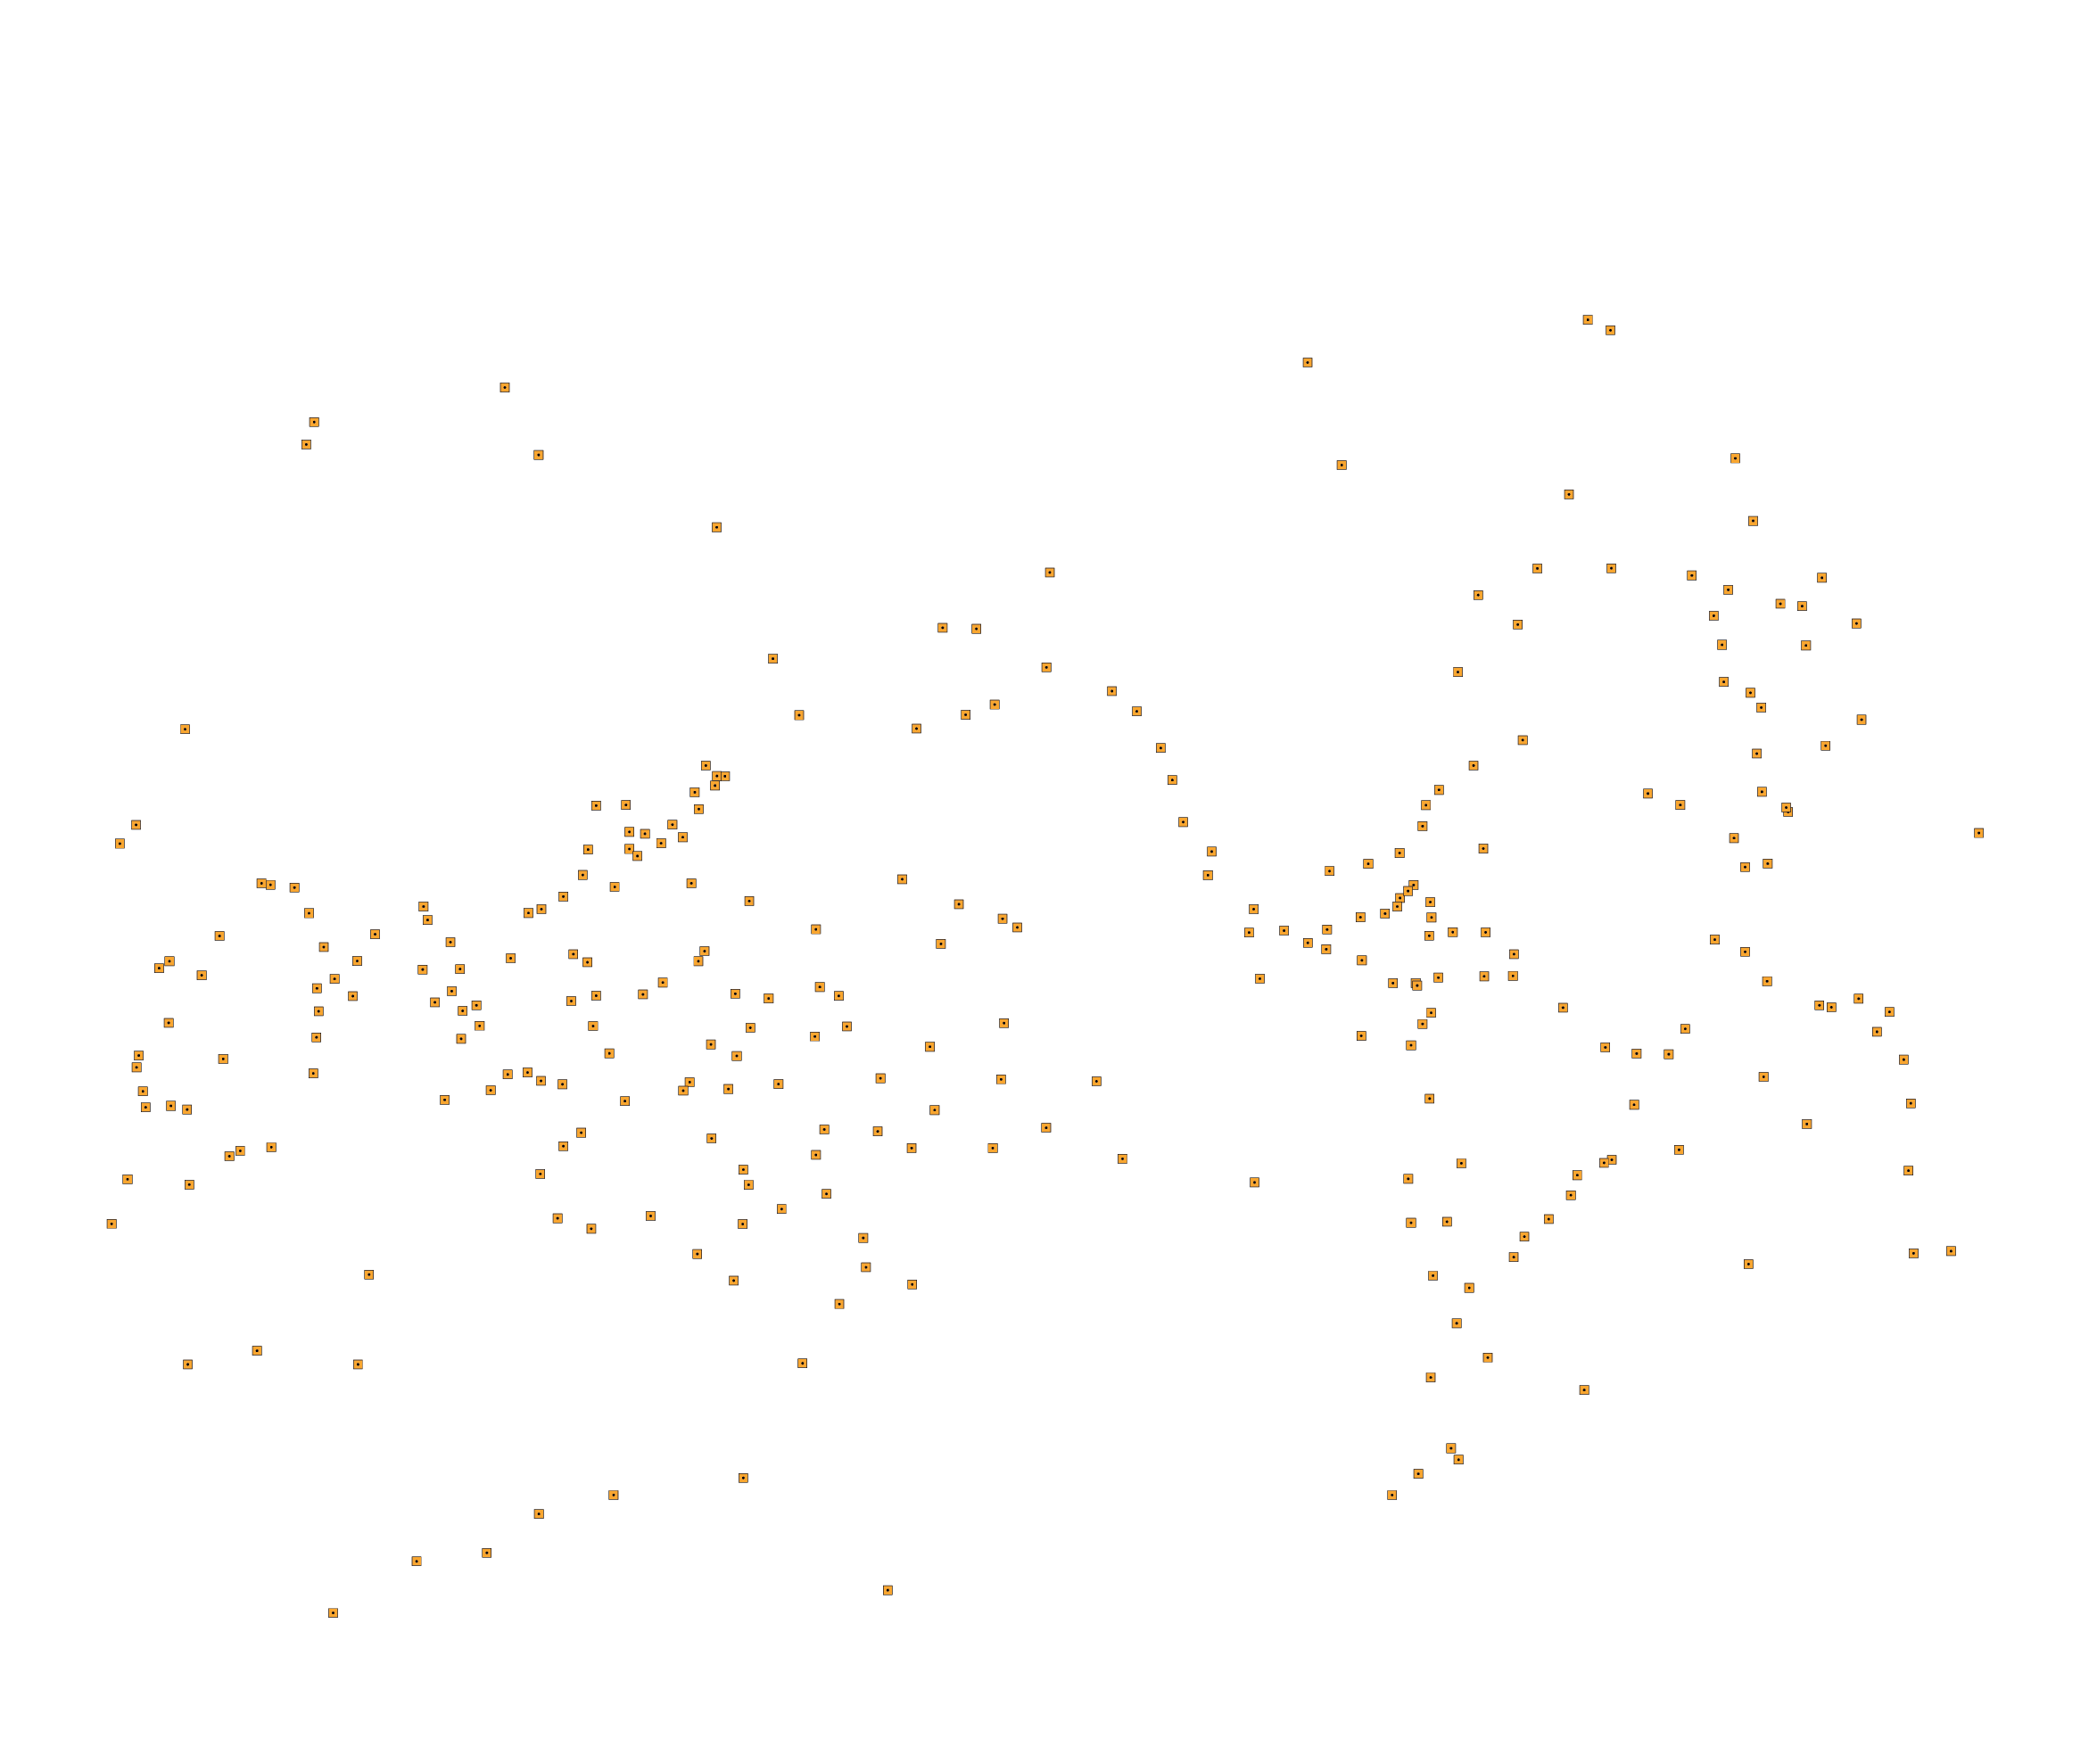
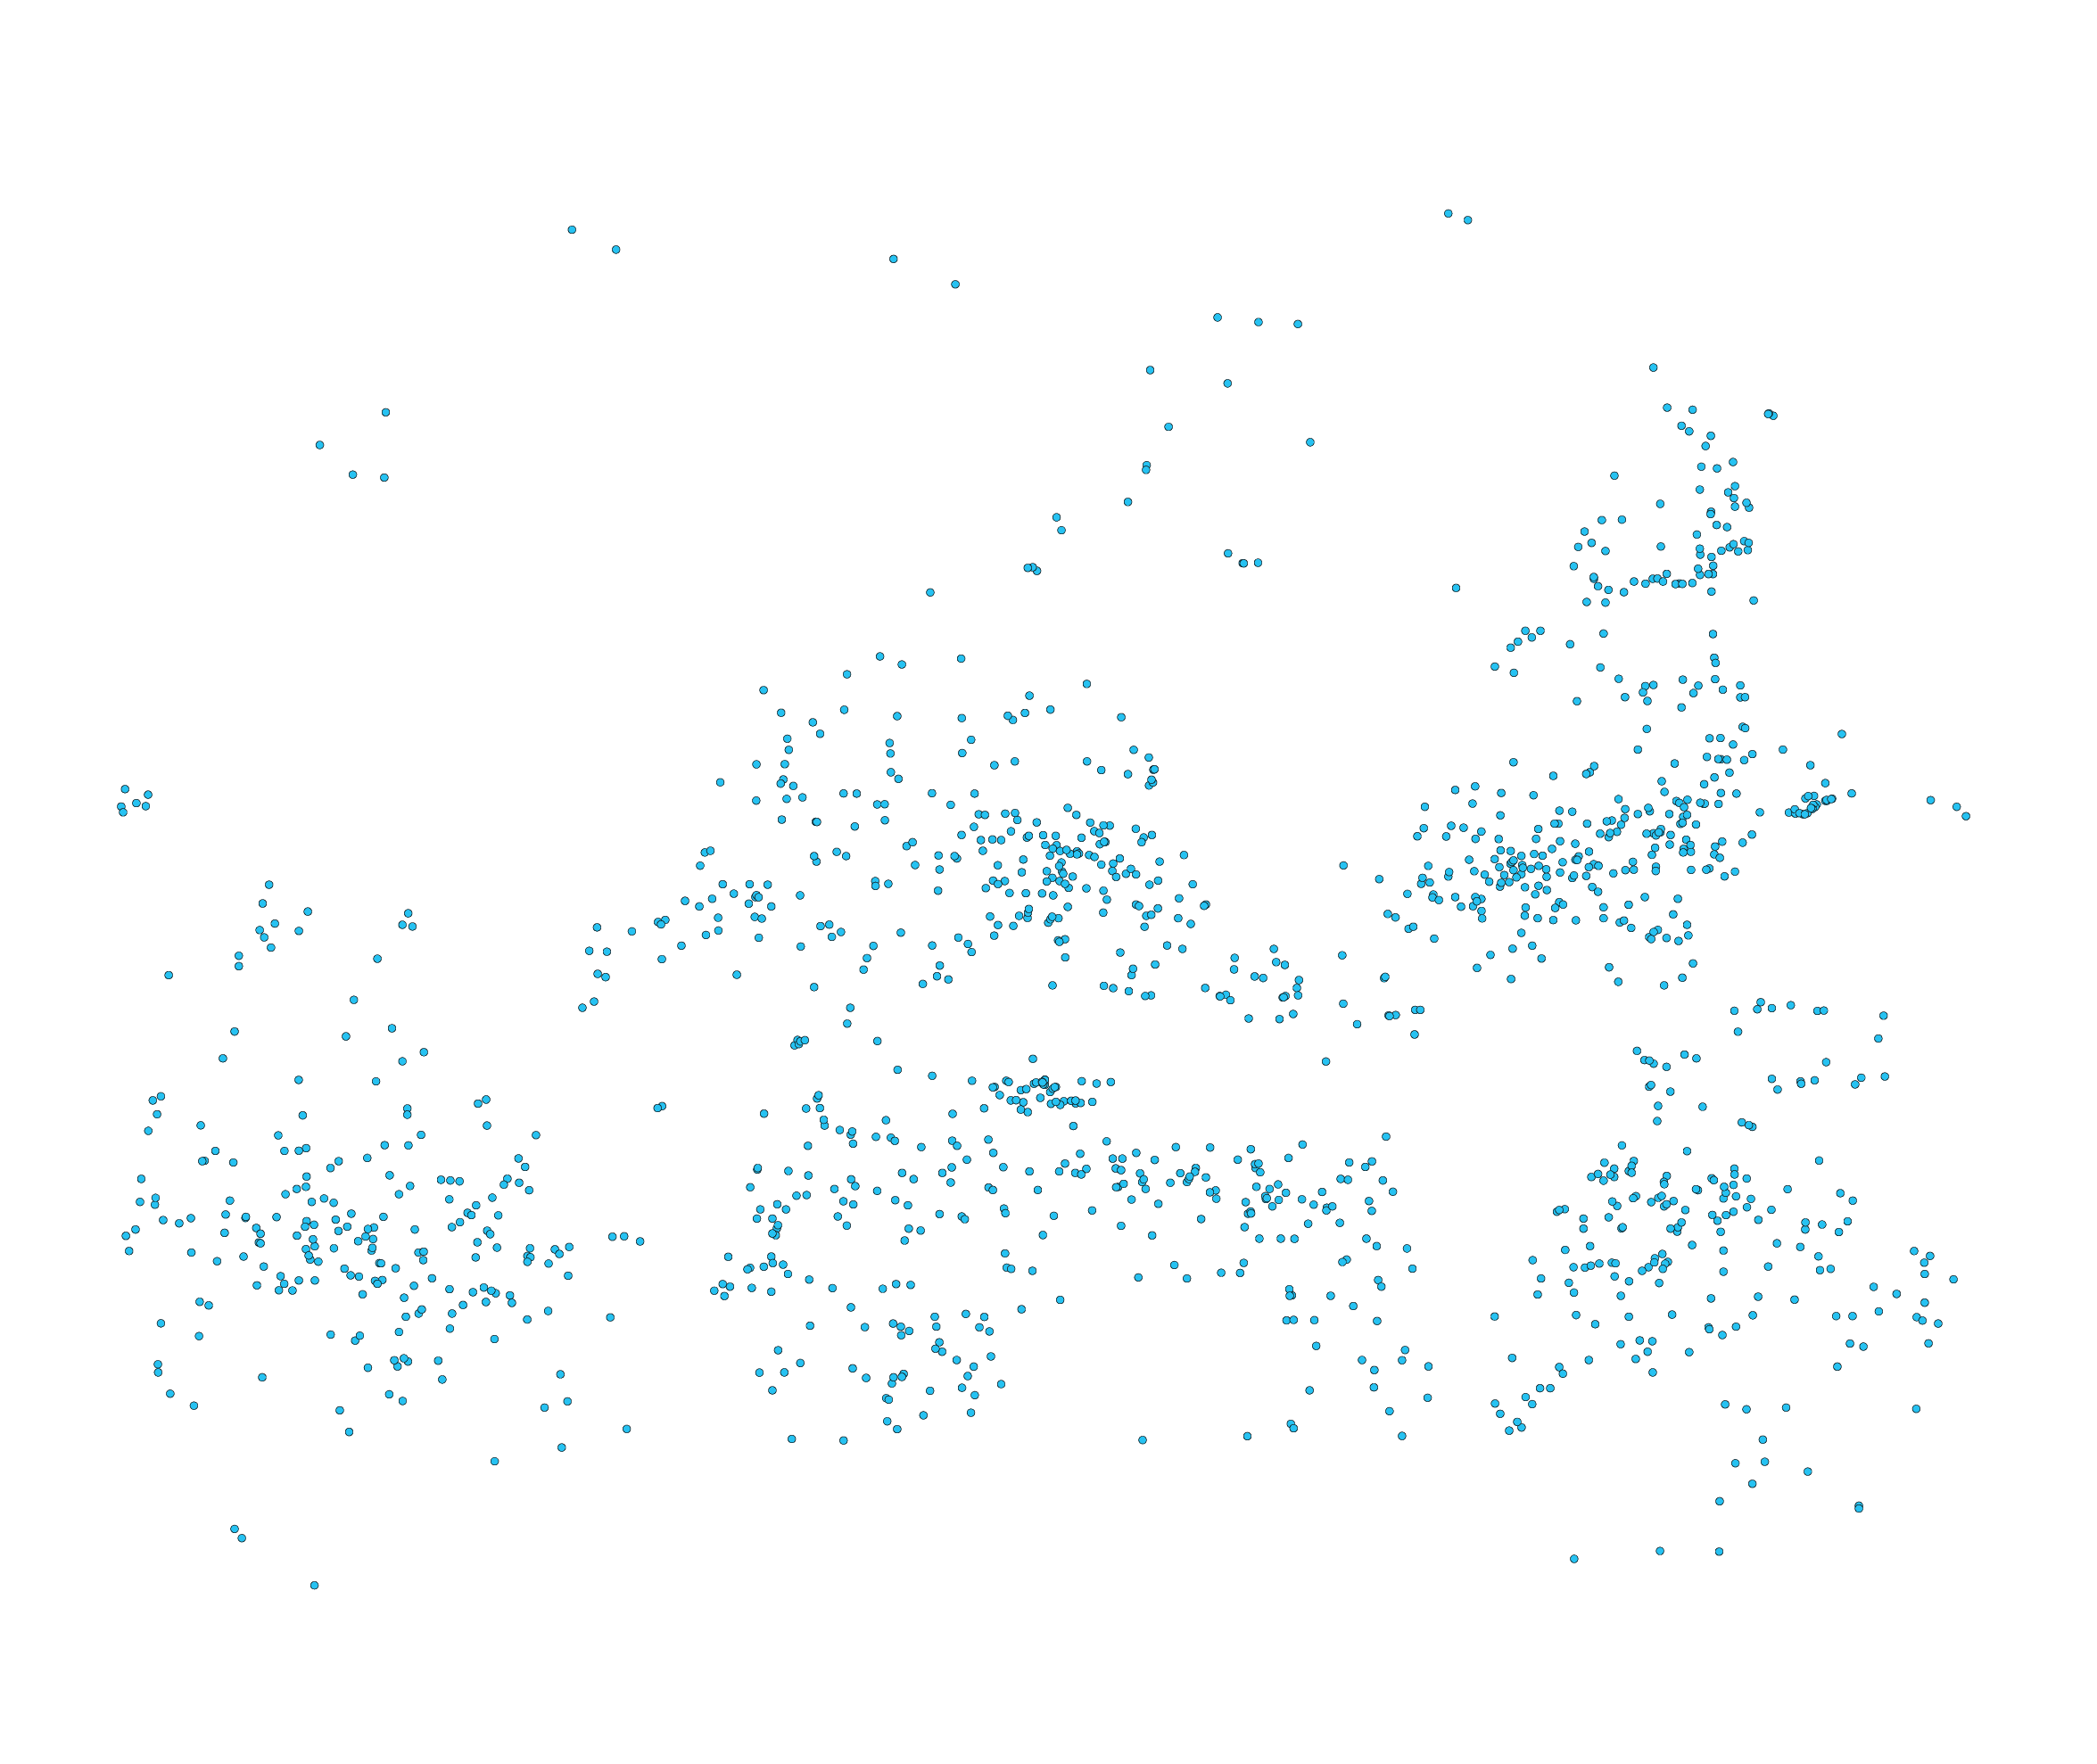
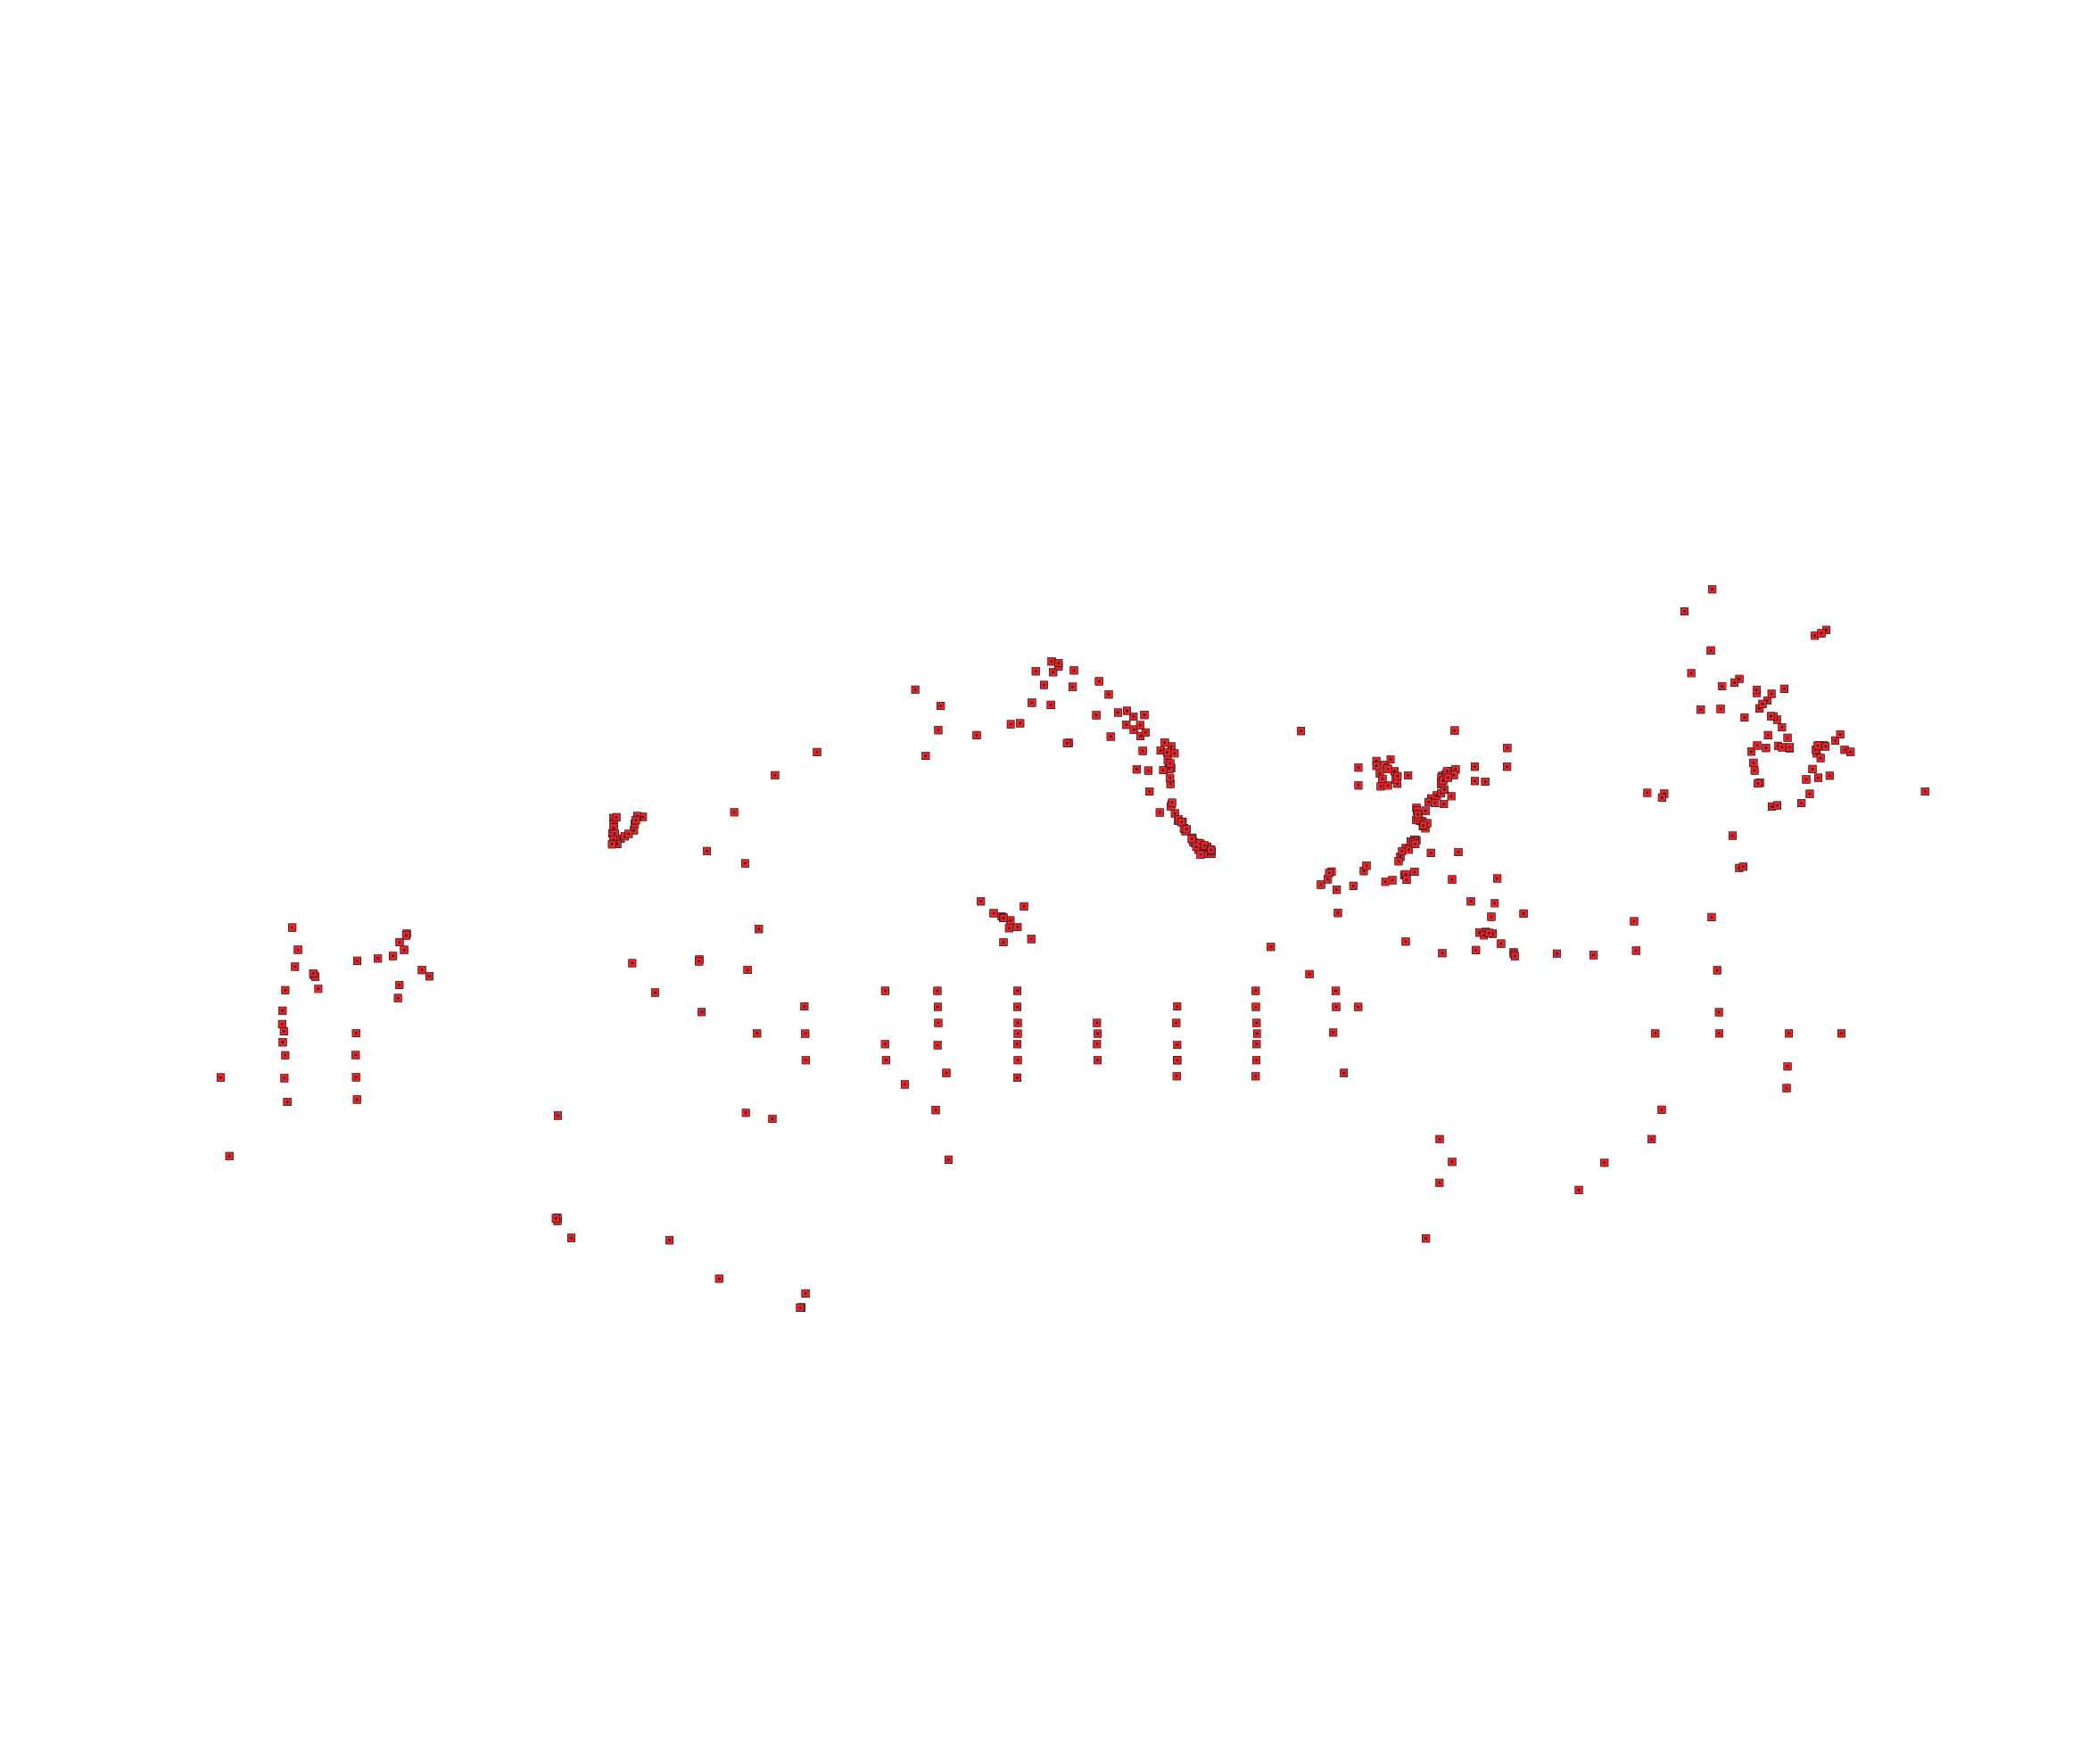
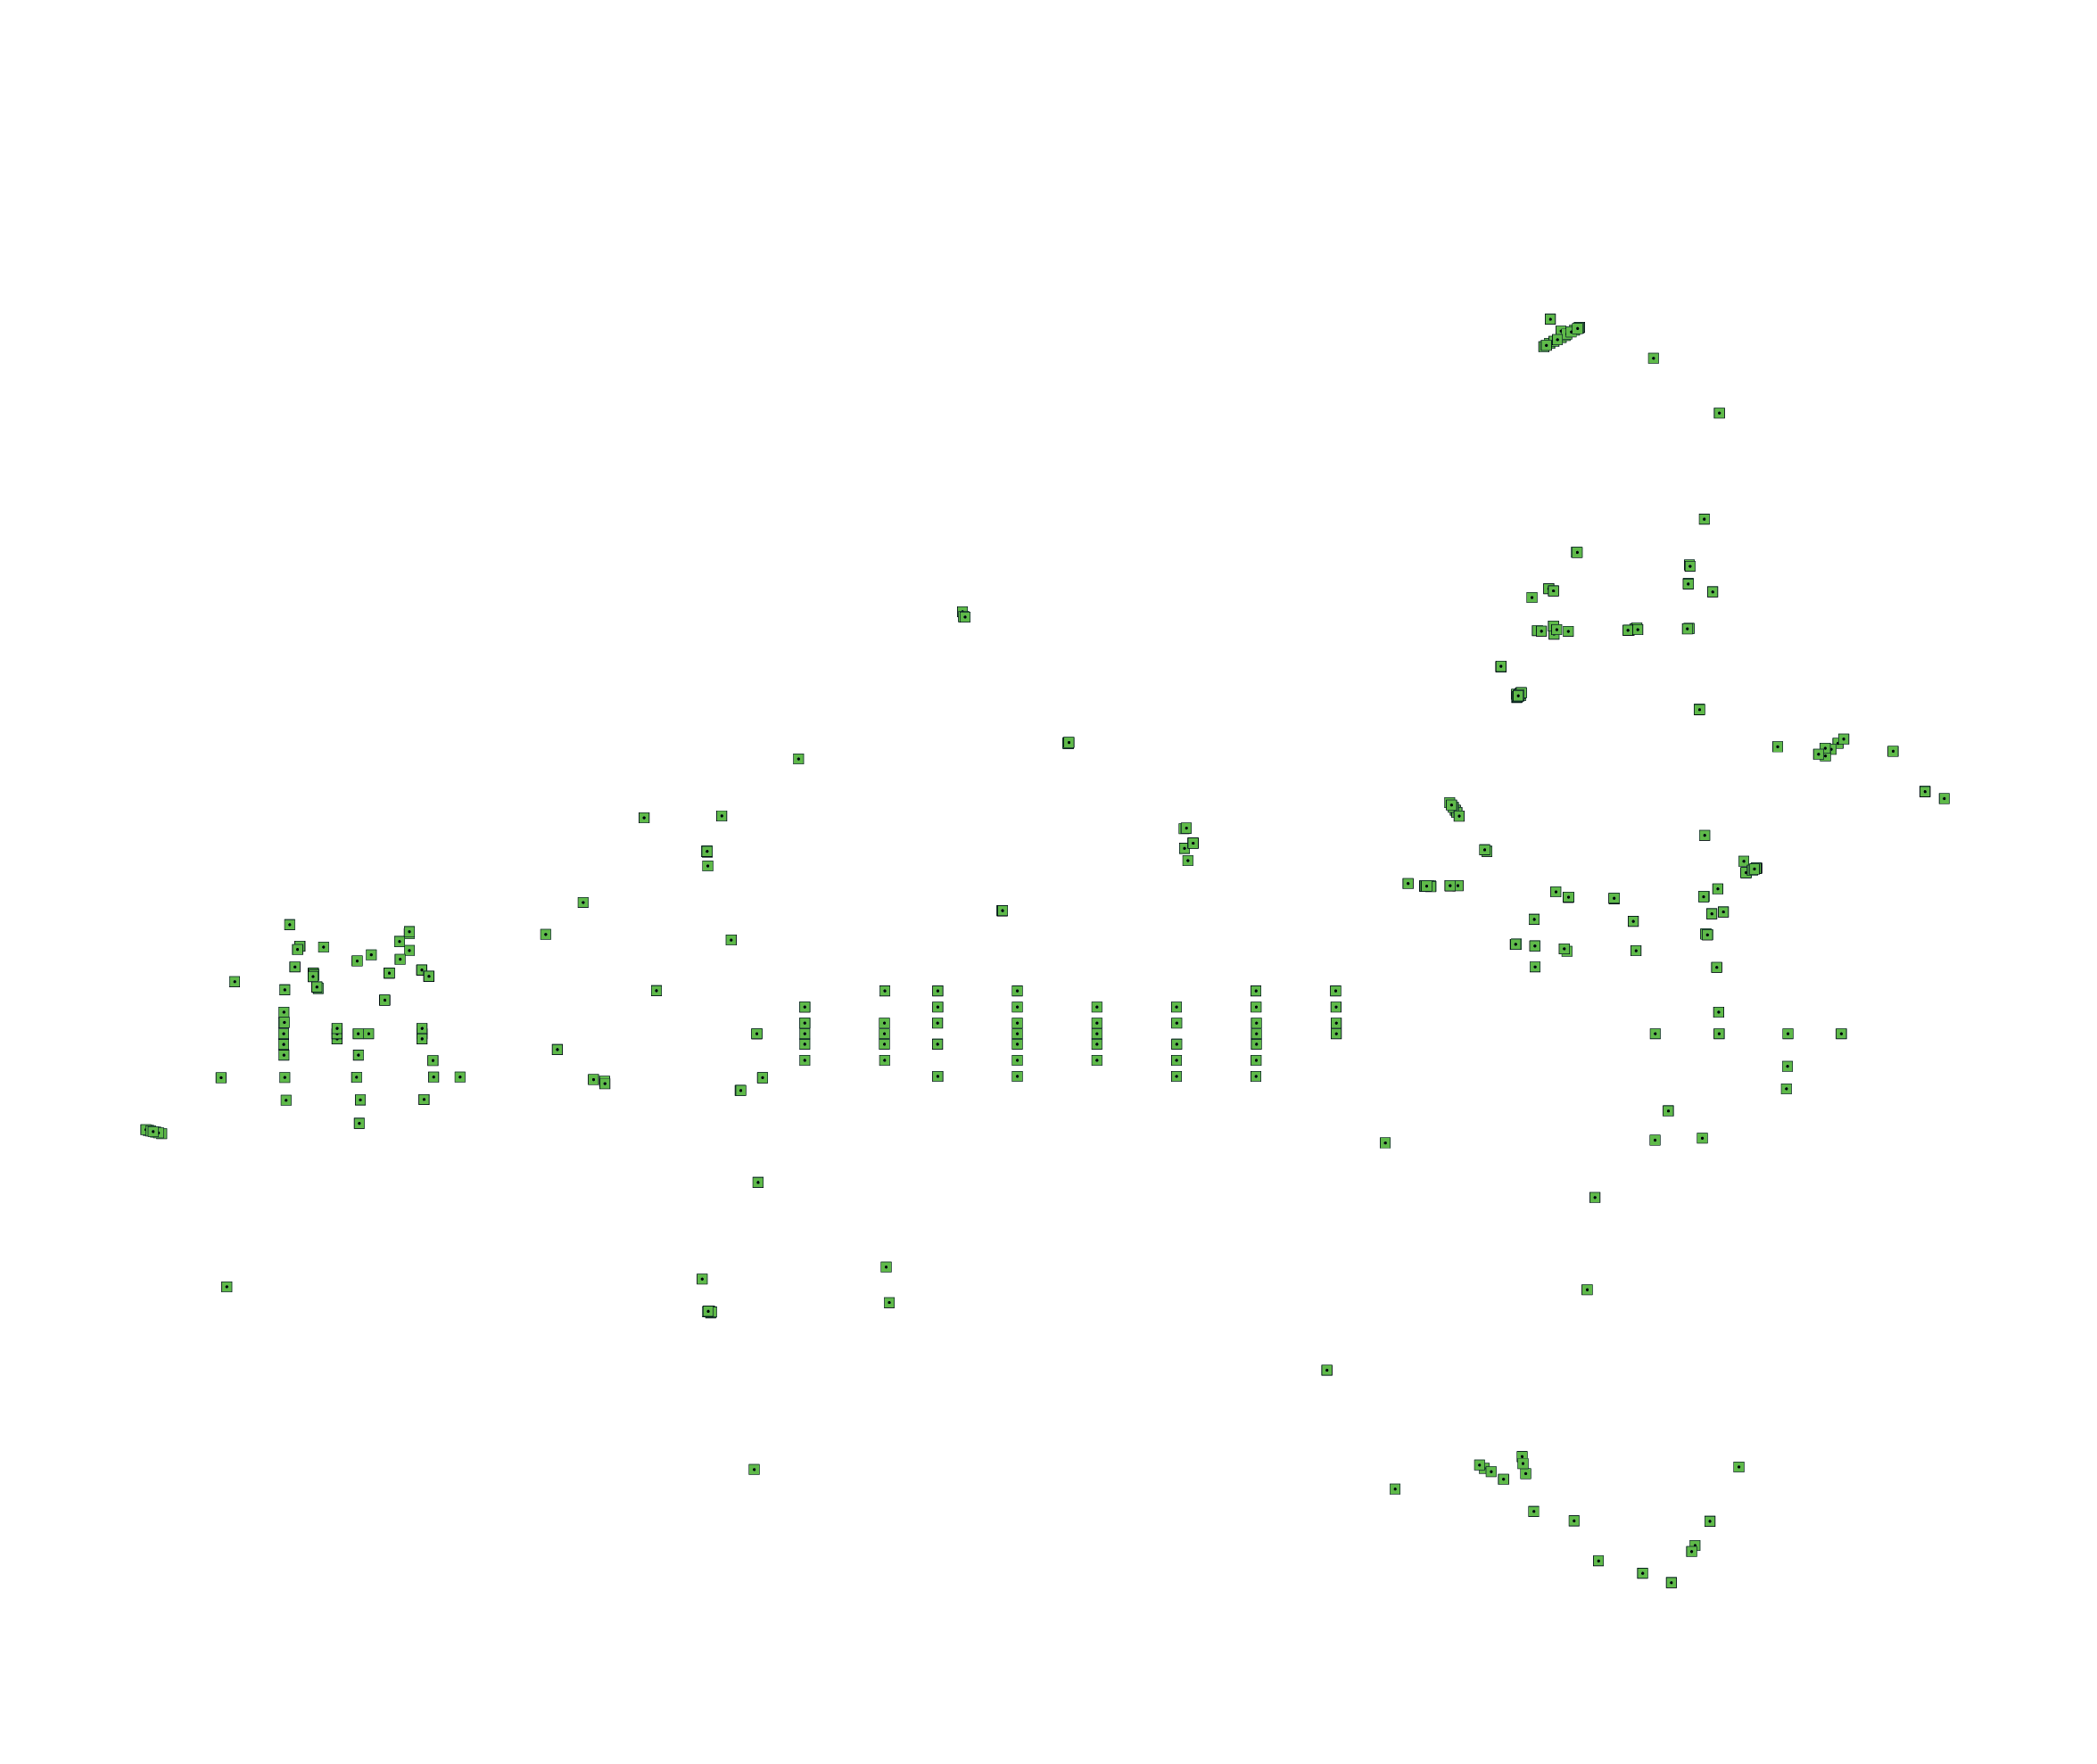
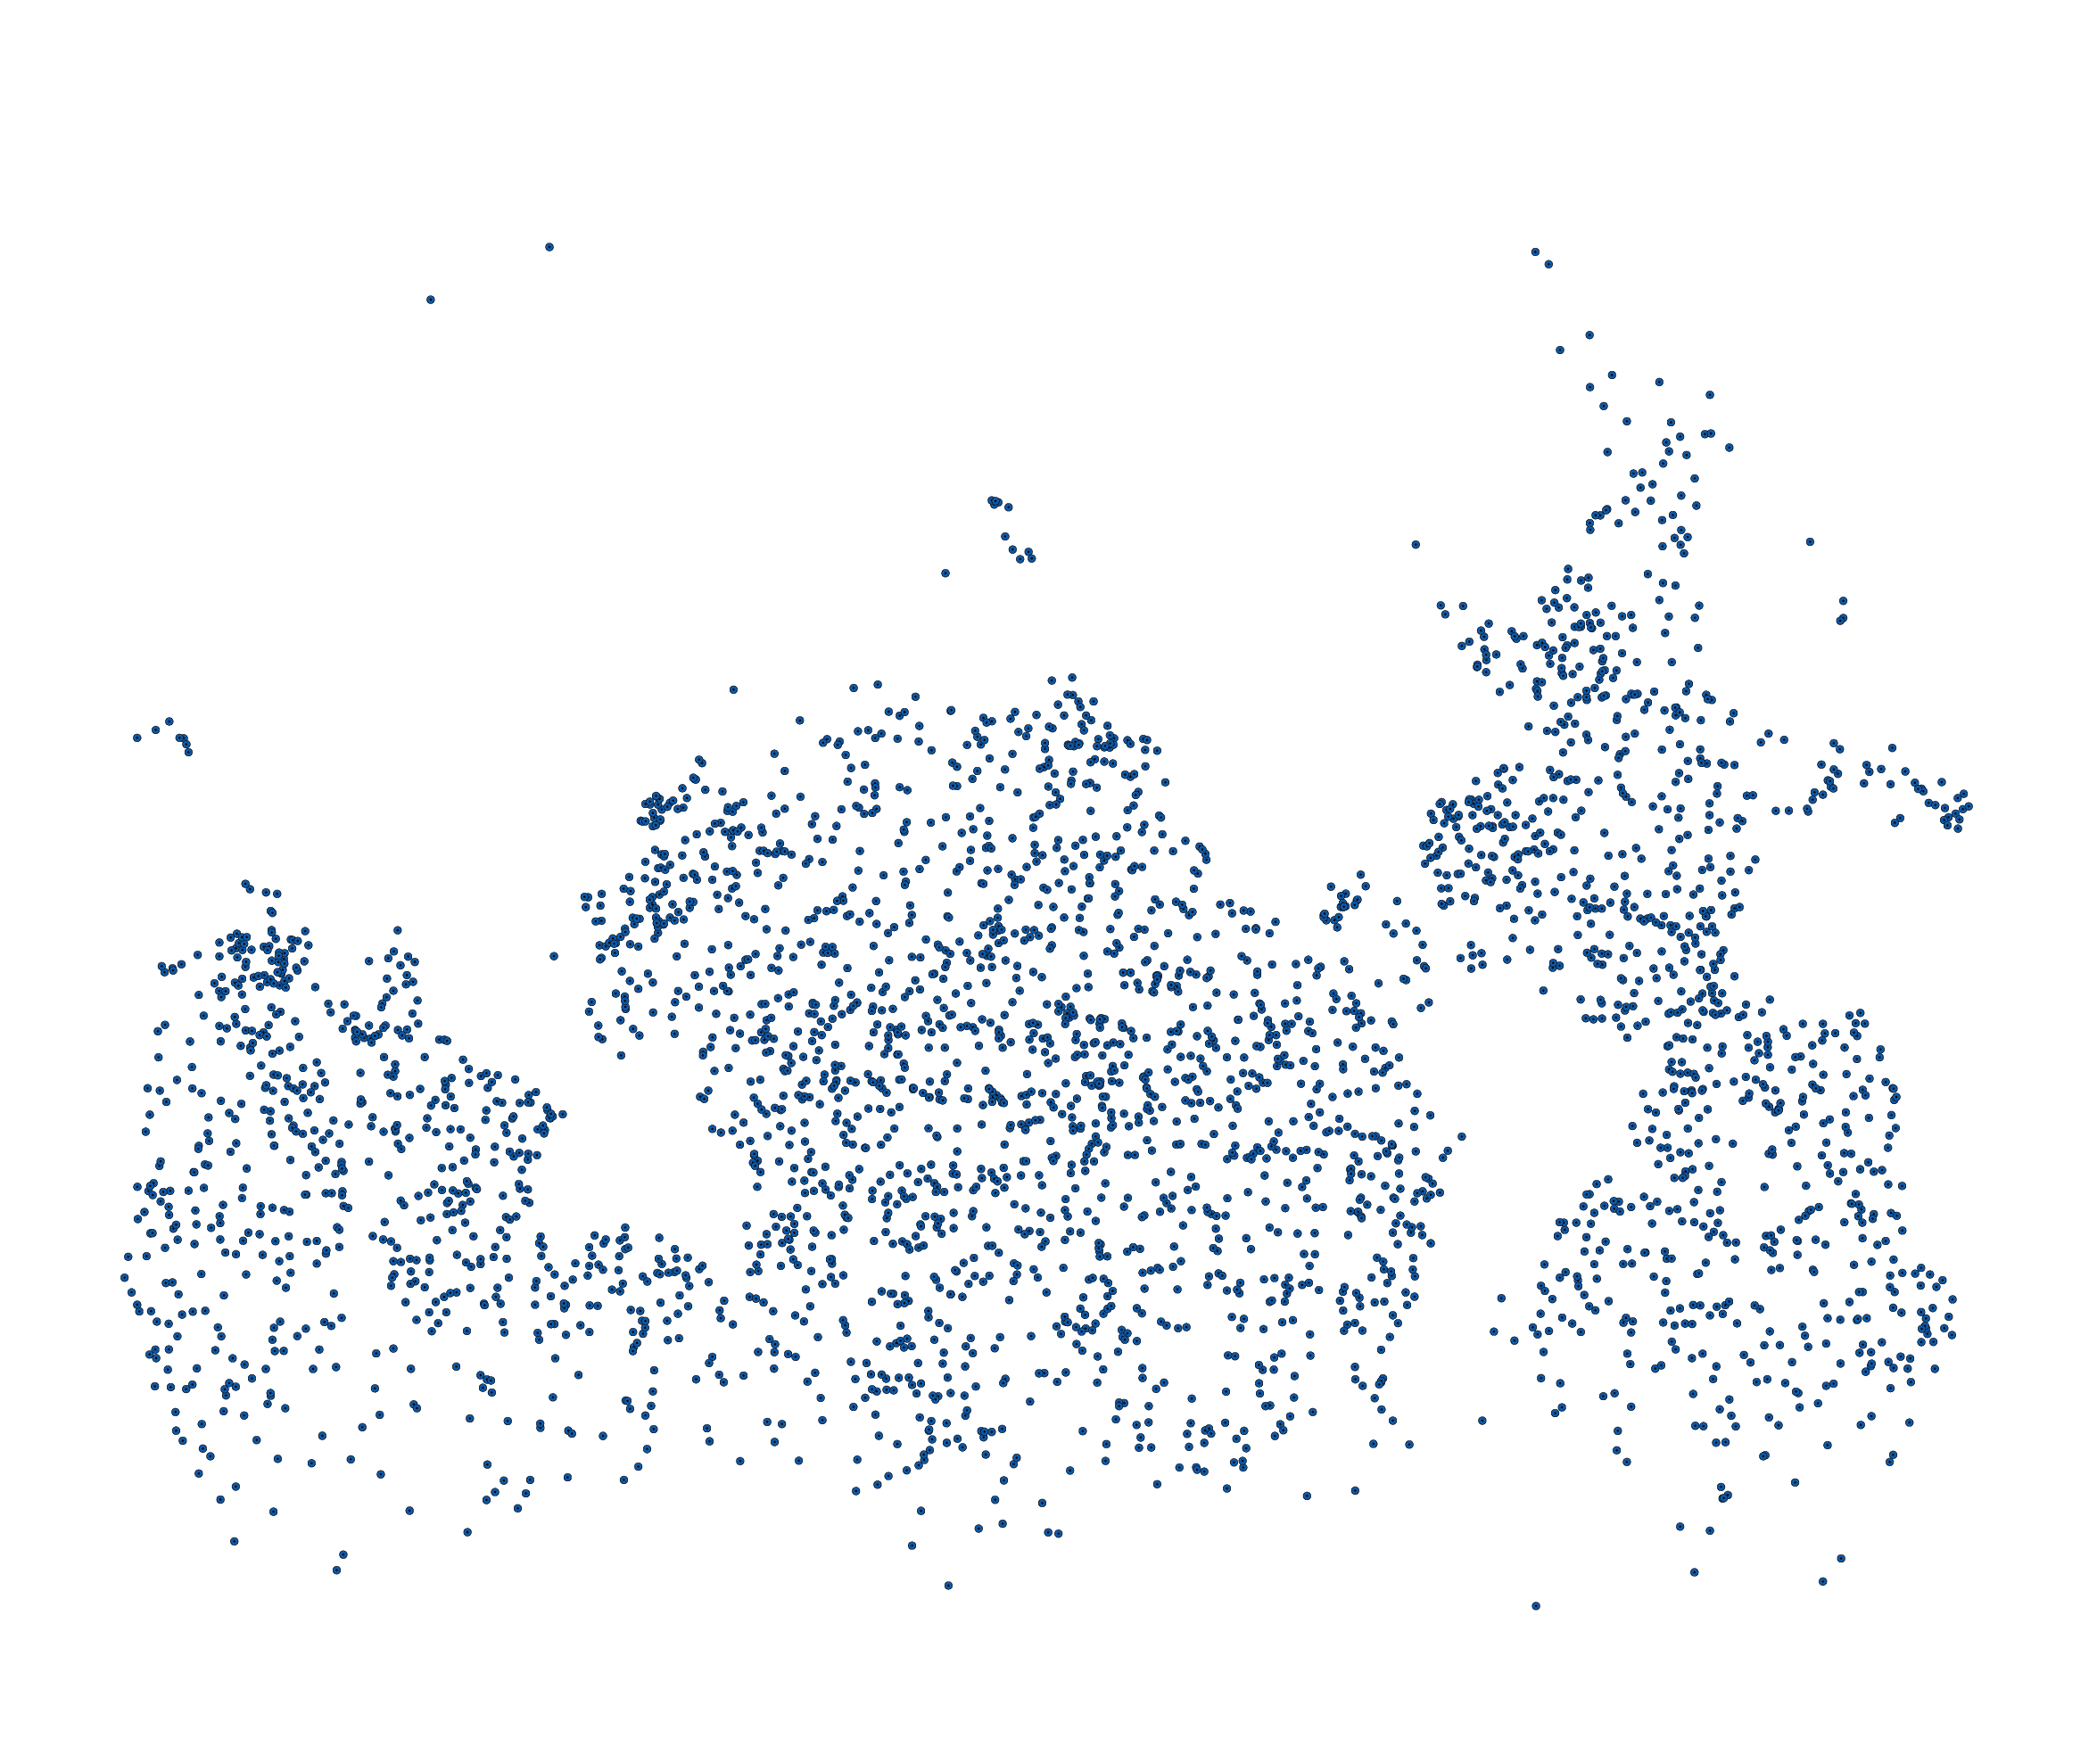
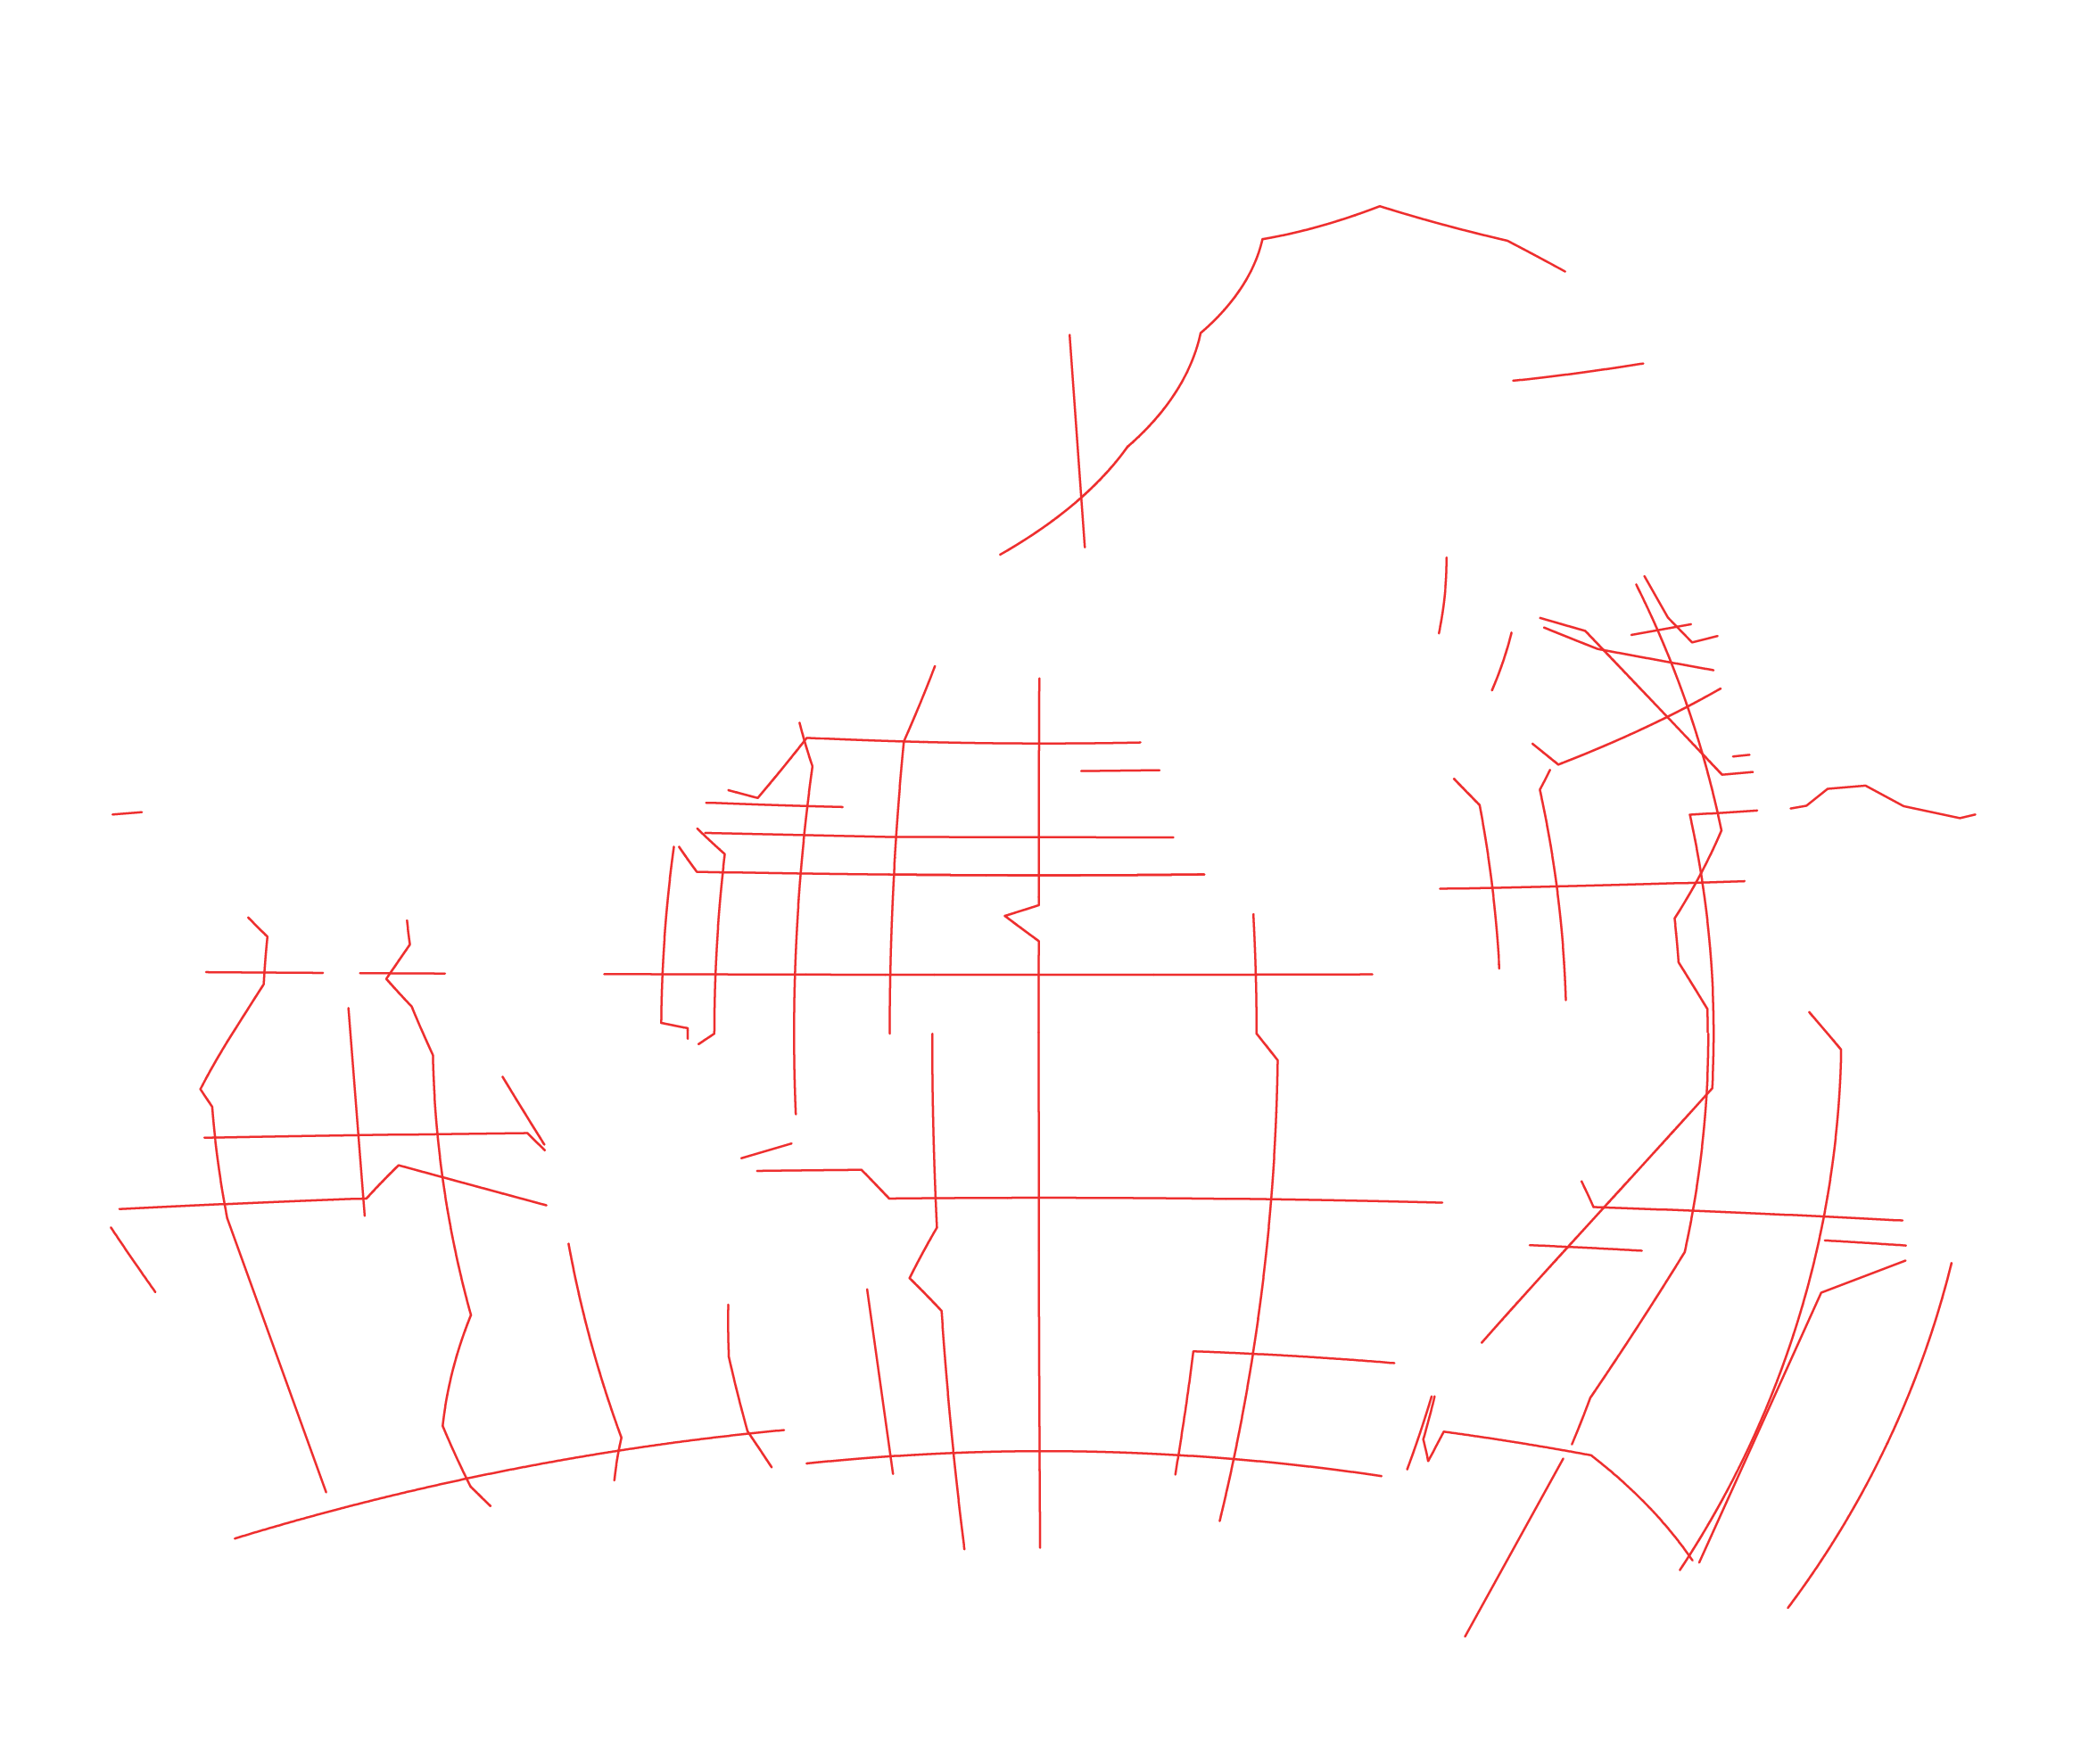
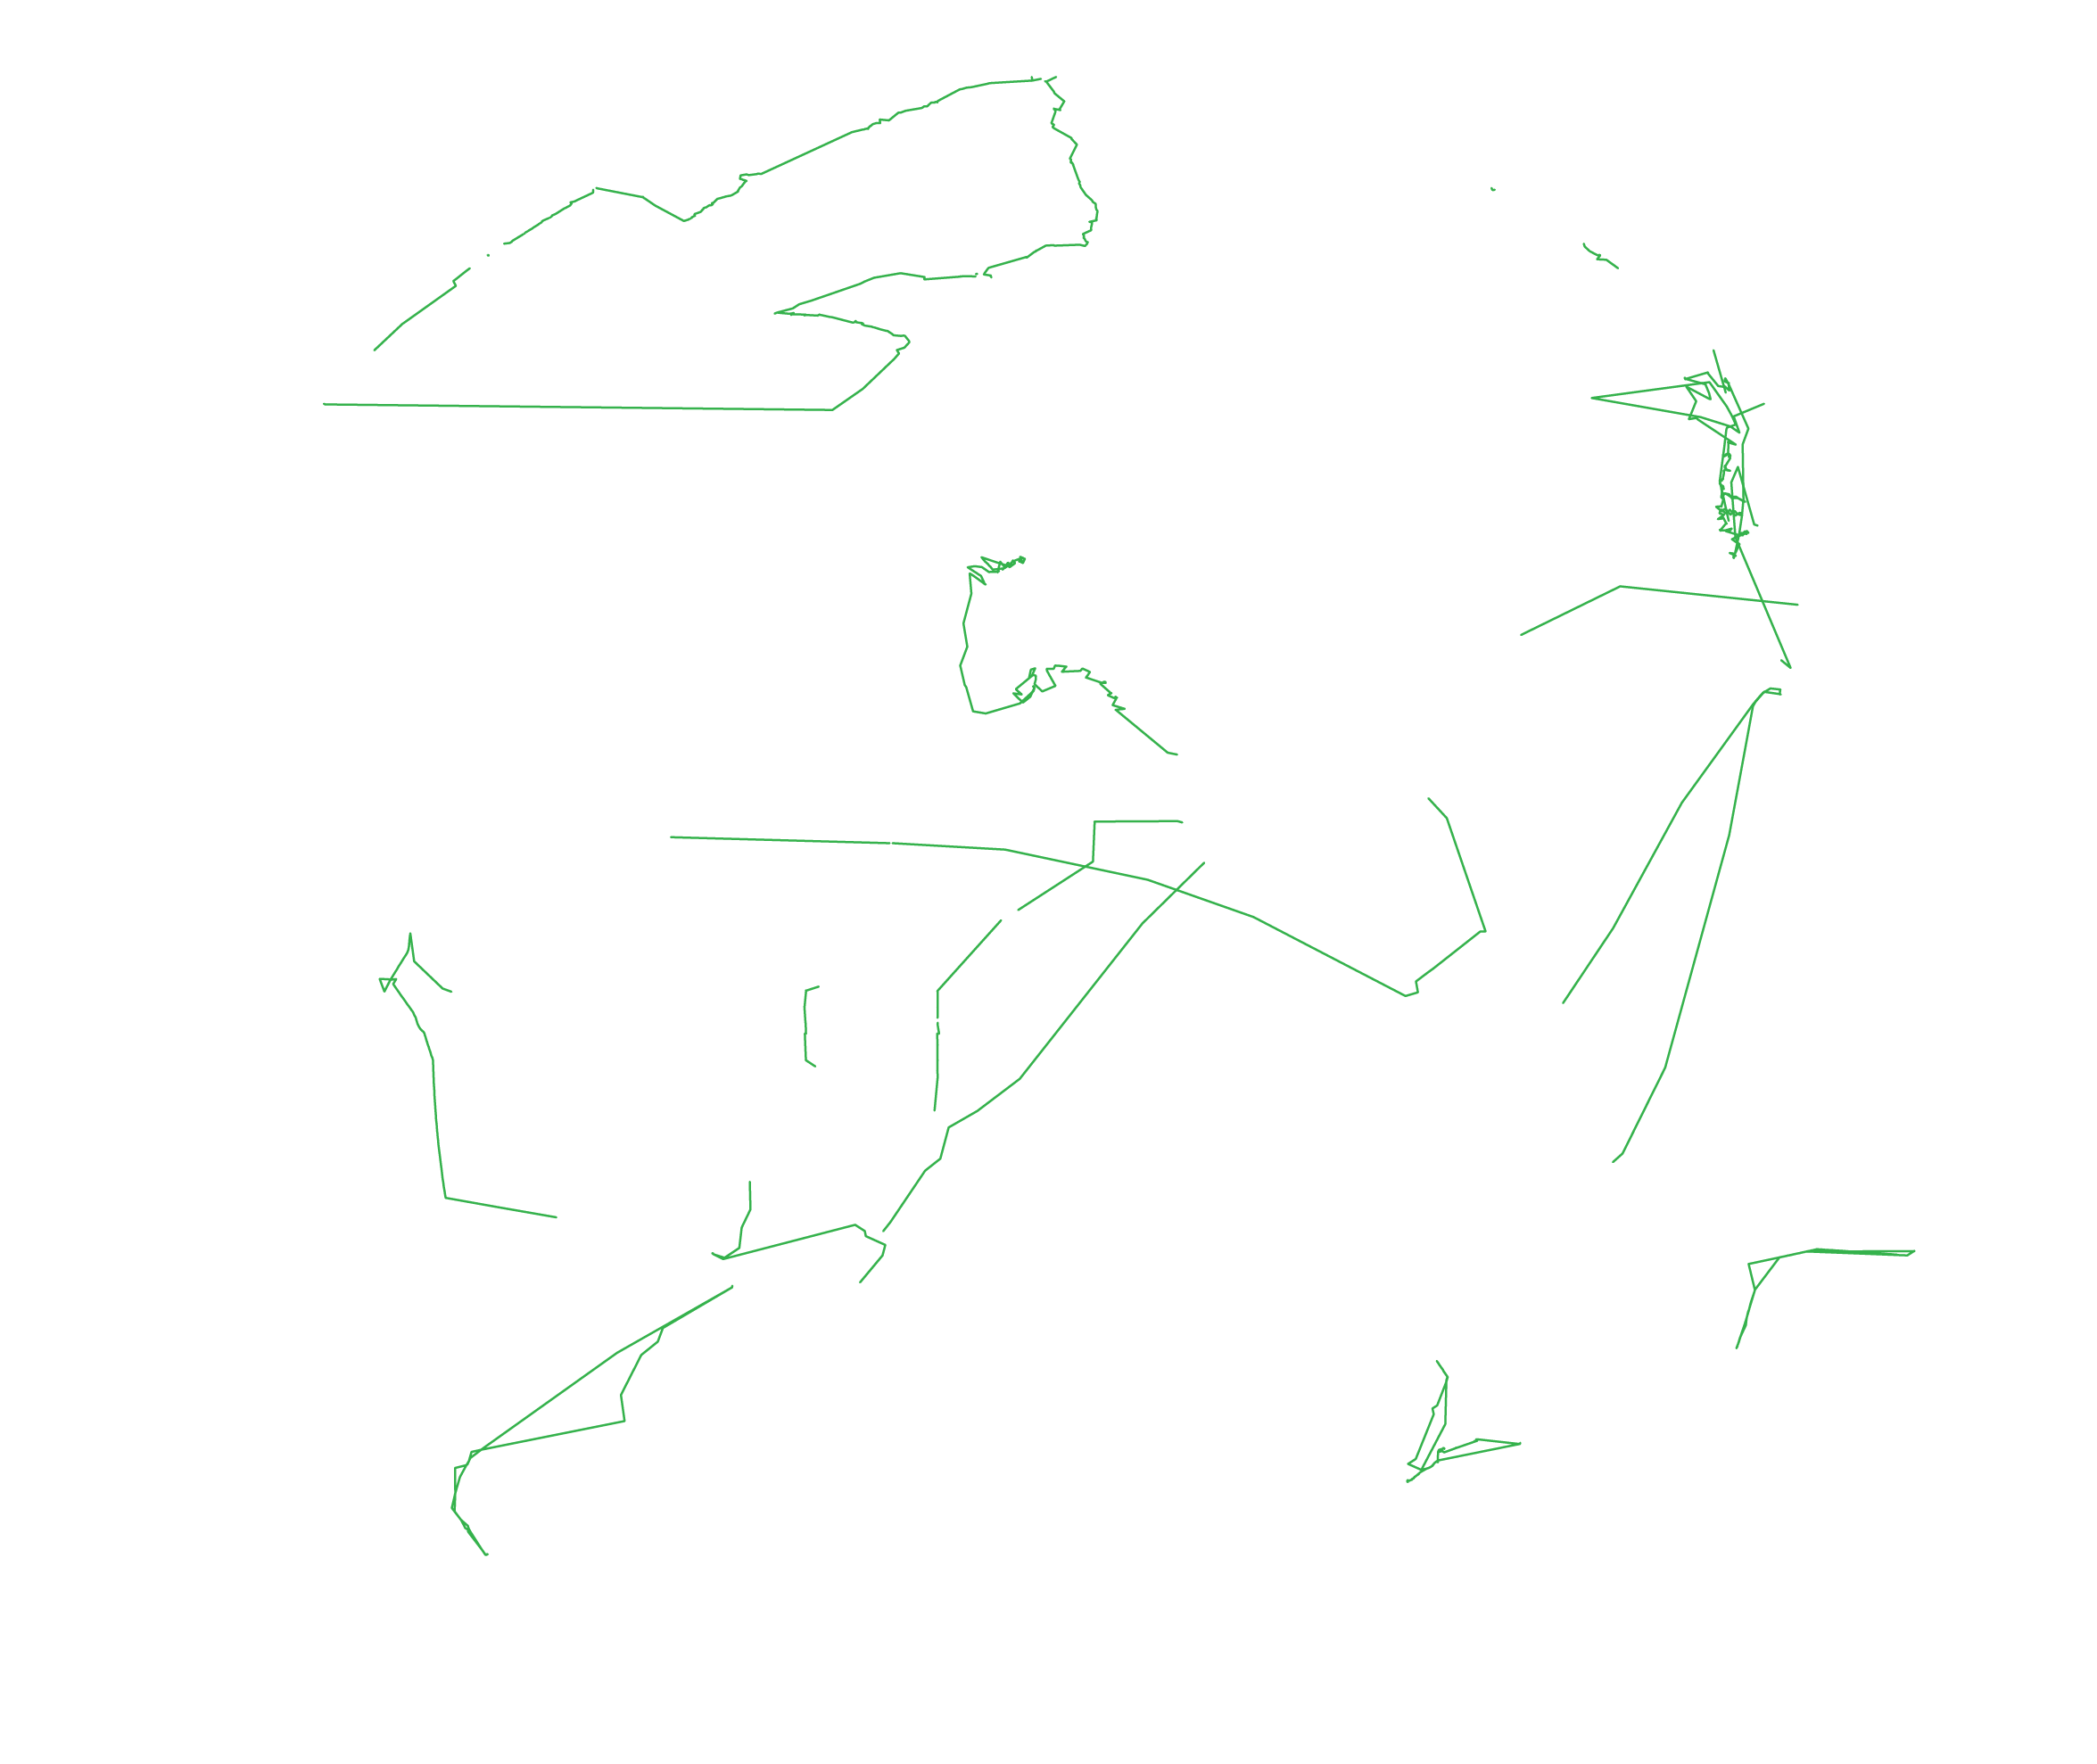
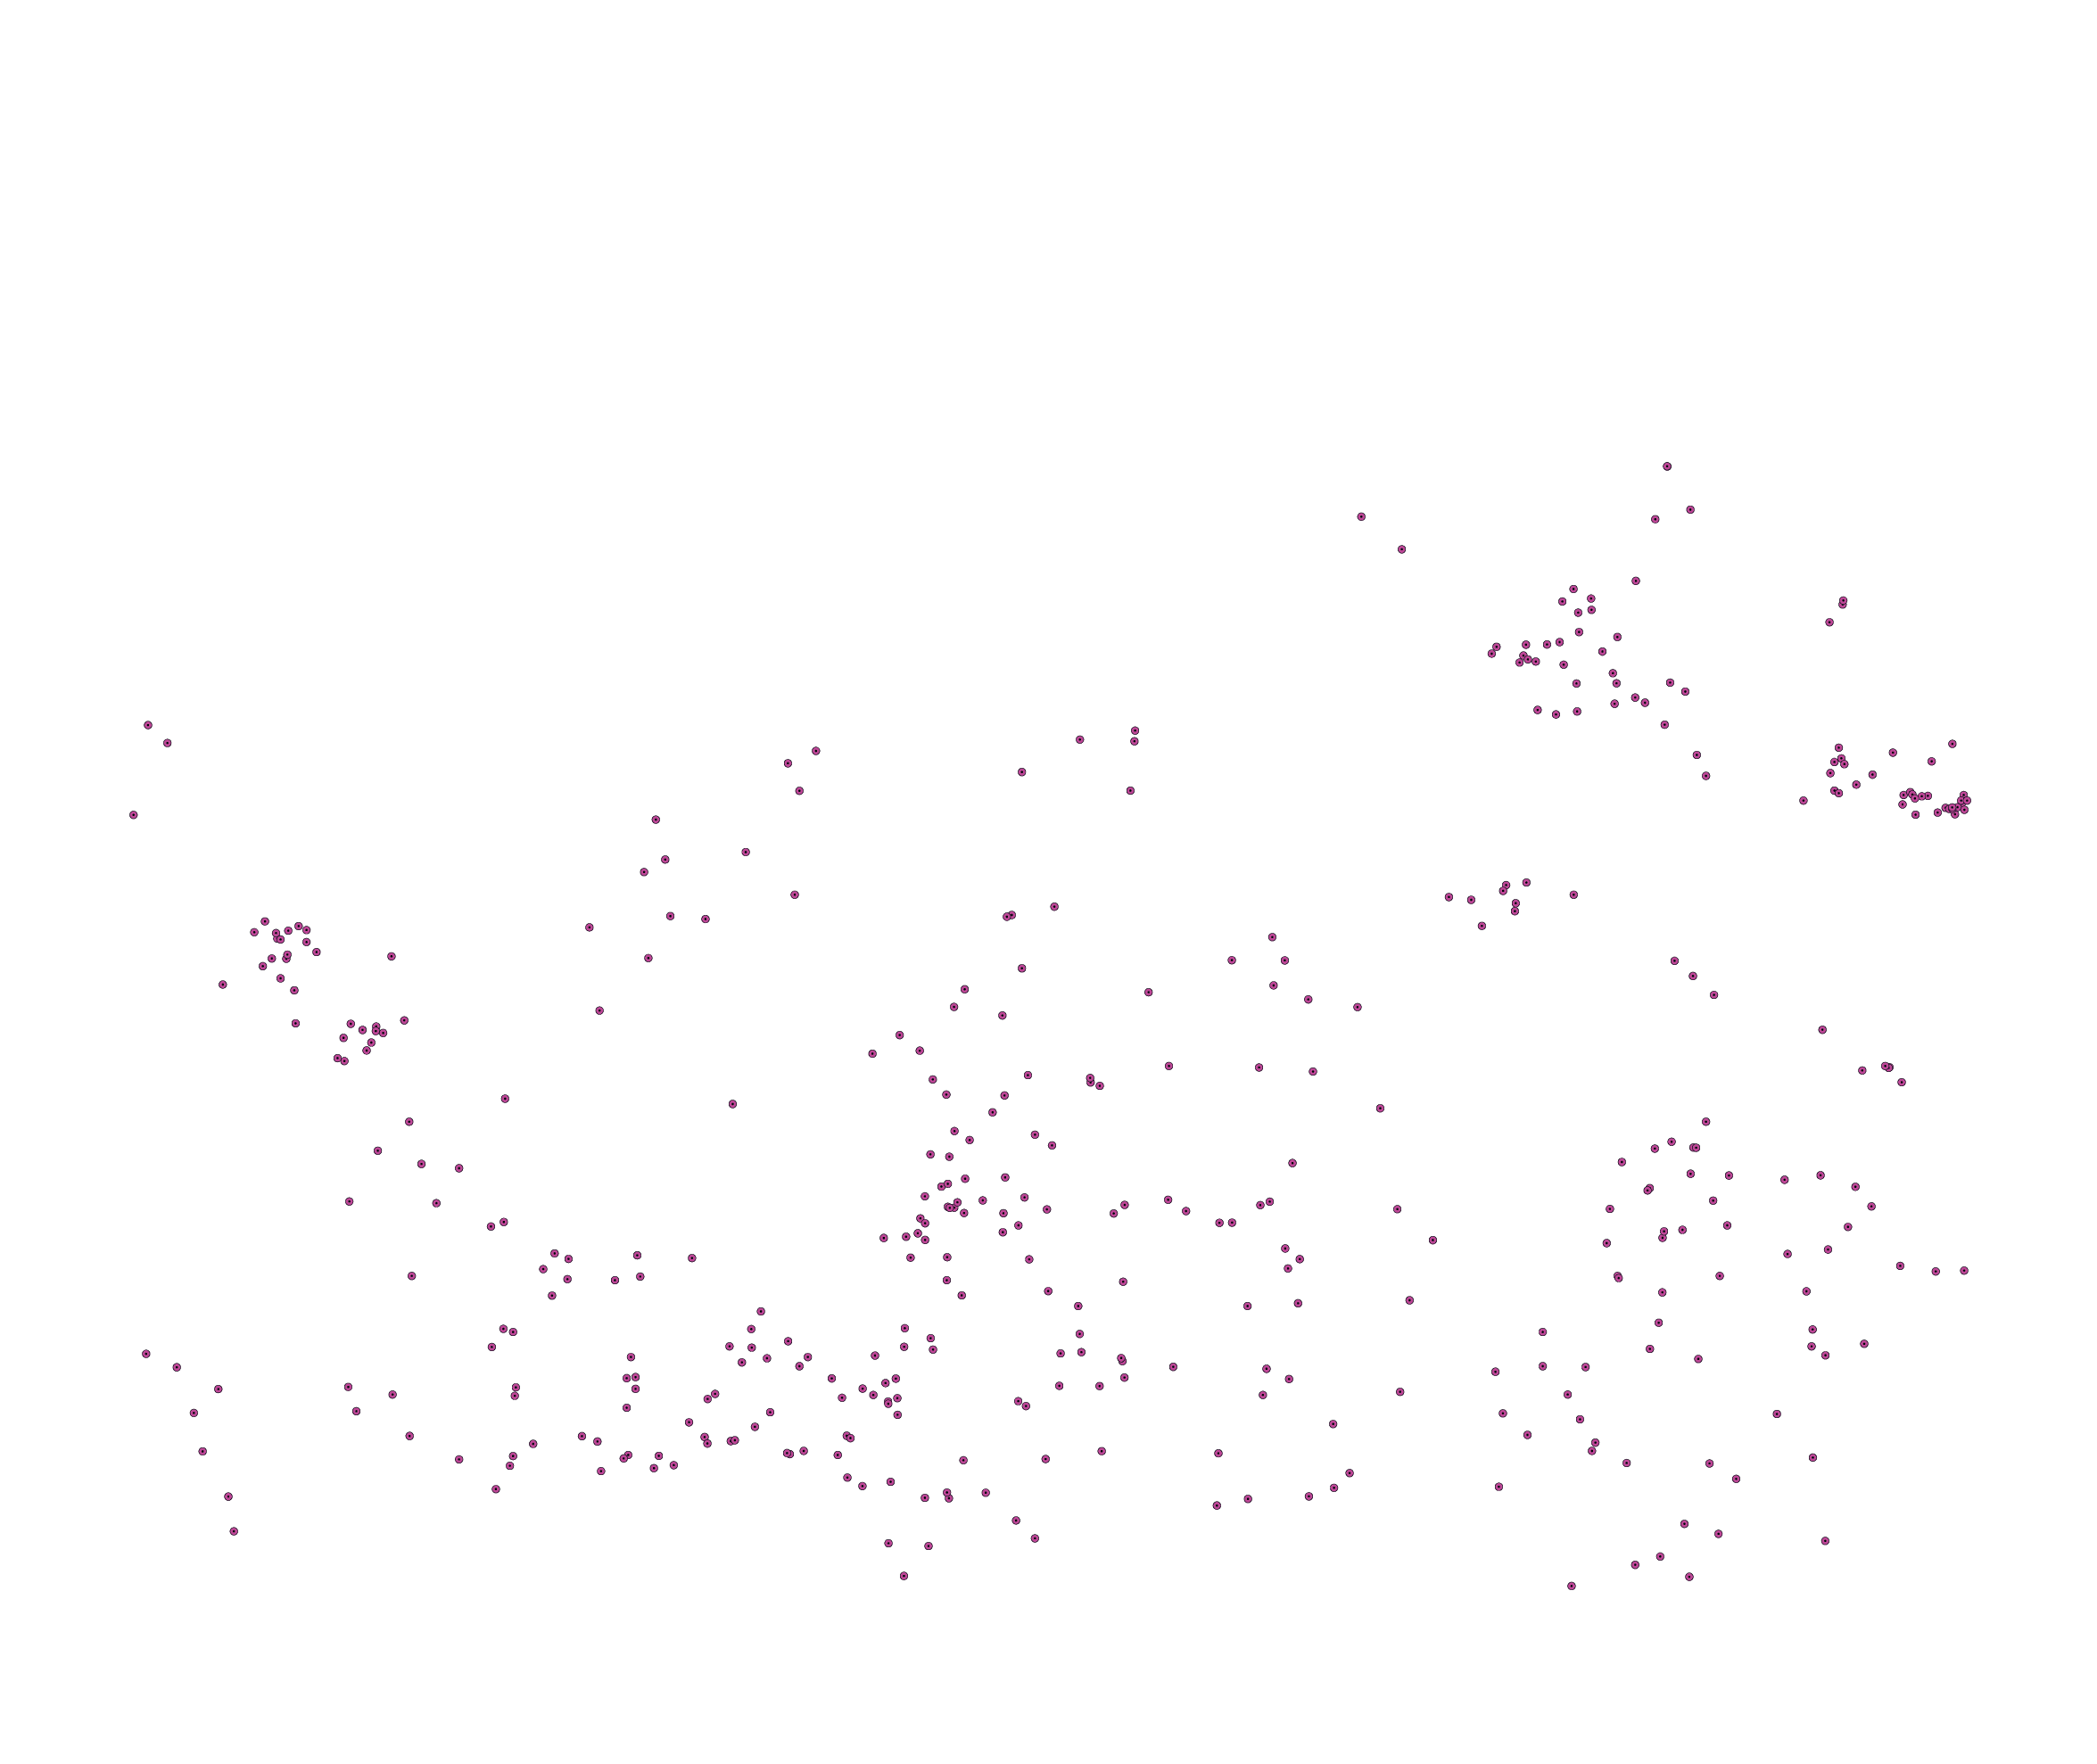
See in situ and emerging networks tables for map legend. Symbol size is not to scale,
in the maps they are exaggerated to an order of hundreds kilometers for readability.

In situ observations

In situ observing instruments continuously monitor the global ocean, from the sea surface to the sea floor, in near real-time. They measure many environmental parameters, providing essential calibration and validation data for satellite observations of the sea surface. These in situ observational platforms also measure surface marine meteorological variables and sample the water column, that cannot be measured by satellites.

Satellite-based observations

The satellite network provides repeated global sampling of key ocean surface variables. These remotely-sensed variables are complementary to in situ observations, in that they fill in the gaps in in situ coverage, both in time and space, while in situ measurements provide critical ground-truthing information for satellite sensors. Together they provide foundational knowledge about the ocean environment and enable a wide range of forecasts and services.

For this reason, it is essential to ensure the continuity of satellite missions in the future. It is also imperative to keep improving the accuracy, coverage, spatial and temporal resolution provided by these satellite missions.

Satellite Years
Essential
Climate 90 92 94 96 98 00 02 04 06 08 10 12 14 16 18 20 22 24 26 28 30
Variables
Sea ice more
Color more
Sea level more
Temperature more
Salinity more
Sea State more
Wind more

Challenges

We still lack long time-series observations from the deep-sea interior, below 2000 meters, and measurements of essential biology and biogeochemistry components of the ocean. We will need advancements in ocean observing instruments, computing, sensors and robotics, in order to expand our ocean monitoring capabilities.

Other challenges include filling observation gaps in the Arctic and Antarctic Ocean all year long and on more biogeochemical and ecosystem variables. Currently, the availability of new technological capabilities for under ice observations, based on ocean gliders and autonomous floats, are enabling us to monitor the increase of CO2 concentrations at the high latitudes.

Main issues

New technology developments, in particular for biological and biogeochemical observations, will require new resources and strong collaboration with industry.
In addition, the cost of some observing techniques and sensors are prohibitive for implementation at a global scale. As we move towards sampling in coastal areas, we will need to explore new solutions, including citizen involvement.

The resources available for sustained ocean observation programmes and for international coordination are insufficient to deliver these advances and largely supported by short-term, research-based project funding.

Coordination and collaborations between ocean observing communities, networks, end-users and third parties are vital to optimize effort and resources towards developing an integrated global ocean observing system.


JCOMM in situ
networks

JCOMM in situ networks Implementation Data & metadata Value to society
Status Real-time Archived high quality Metadata
Ship based meteorological
measurements – SOT/VOS
Ship based meteorological measurements – SOT/VOS Observations enhance quality of weather forecasts and numerical weather prediction for the safety of life at sea, Ship based aerological along with improved understanding of global climate.
Ship based aerological
measurements – SOT/ASAP
Ship based aerological measurements – SOT/ASAP Observations enhance quality of weather forecasts and numerical weather prediction for the safety of life at sea, Ship based aerological along with improved understanding of global climate.
Ship based oceanographic
measurements – SOT/SOOP
Ship based oceanographic measurements – SOT/SOOP Data supports operational and research applications including tropical ocean variability and prediction; global and regional heat storage; ocean transport and circulation; sea state and model evaluation; climate change.
Sea level gauges – GLOSS Sea level gauges – GLOSS Vital for research into sea level change and ocean circulation; coastal protection during storm surges; flood warning and monitoring tsunamis; tide tables for port operations, fishermen, and recreation.
Drifting and polar buoys – DBCP Drifting and polar buoys – DBCP Increase the quantity, quality, global coverage and timeliness of real-time and delayed mode MetOcean data in Numerical Weather Prediction and Marine Scientific Research for societal benefits, such as disaster risk reduction from tropical cyclones and tsunamis.
Moored buoys – DBCP Moored buoys – DBCP Increase the quantity, quality, global coverage and timeliness of real-time and delayed mode MetOcean data in Numerical Weather Prediction and Marine Scientific Research for societal benefits, such as disaster risk reduction from tropical cyclones and tsunamis.
Interdisciplinary
moorings – OceanSITES
Interdisciplinary moorings – OceanSITES Climate relevant long-term reference time-series; air/sea flux data for Numerical Weather Prediction validation; observing interactions across all marine disciplines; full ocean depth observations; acidification, carbon fluxes; deep ocean warming, etc.
Profiling floats – Argo Profiling floats – Argo Real-time data for ocean services, seasonal forecasts and high-quality data for climate research.
Repeated transects –
GO-SHIP
Repeated transects – GO-SHIP Reference data to discern climate trends and human impacts.

Emerging networks and extending capabilities

Emerging networks and extending capabilities Readiness level Value to society
OceanGliders OceanGliders PILOT to MATURE Sustained observations from the open ocean to the shore for regional climate studies and storm prediction and ocean health assessment, with a direct impact on fisheries assessment, transportation, climate, recreation and ocean biodiversity management.
HF radars HF radars MATURE regionally; PILOT globally Speed and direction of ocean surface currents in near real-time for coast guard search and rescue, oil and hazardous material spills, water quality monitoring and, for safe marine navigations.
Surface based measurements CO2
- SOCONET
Surface based measurements CO2 - SOCONET PILOT Reference surface CO2 data for ocean acidification and to quantify global air-sea CO2 fluxes.
Biogeochemistry &
Deep floats – Argo
Biogeochemistry & Deep floats – Argo PILOT Observations of biogeochemical processes globally, under seasonal sea-ice, throughout the year, and across all weather conditions for monitoring climate variability and change as well as the marine ecosystem health; deep ocean variability.
Animal borne sensors Animal borne sensors PILOT to MATURE Unique source of real-time ocean and climate data in critical data-poor polar regions.

More information on Global Ocean Observing System readiness level at: www.goosocean.org

CALL FOR ACTION

Through many years of support from WMO Members, IOC Member States, governments, and institutions, an initial global ocean observing system under JCOMM has been established. This system delivers data and information to enable provision of a range of global and regional services mainly based on weather and climate applications.

JCOMM calls on governments, and others, at local, national, and regional levels to:

∙ increase their contributions towards growing the ocean observing system to meet the increasing need for ocean information and improved services, in order to address a wide range of sustainability issues and encourage growth in ocean economies

∙ enhance collaboration, openly share data, and optimize efforts and resources through engagement with a growing global ocean observing enterprise

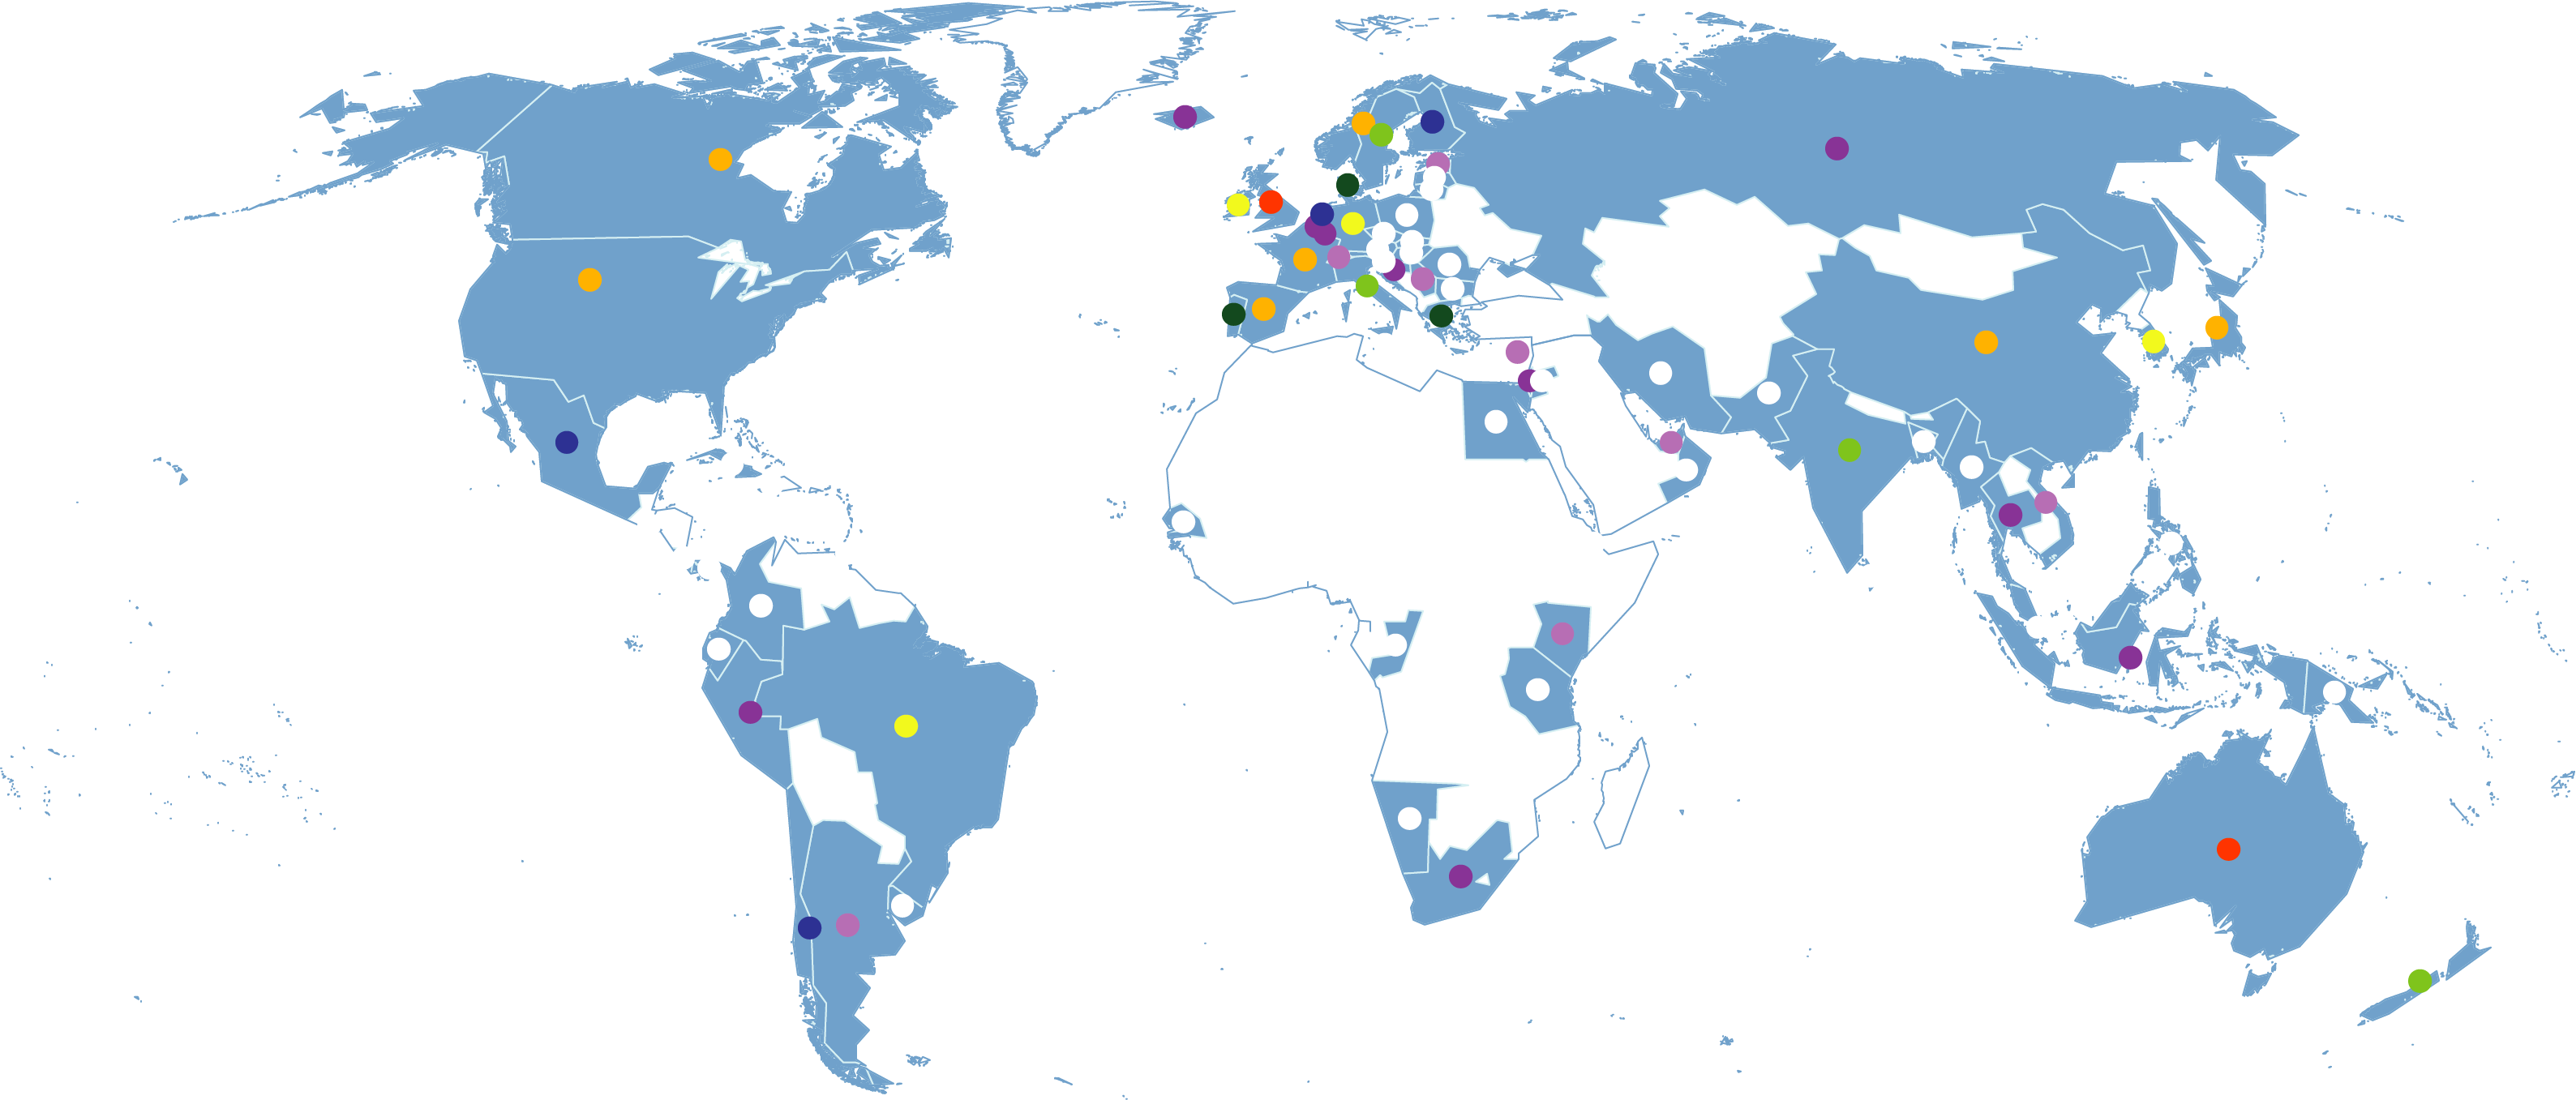
Number of supported networks

Argentina, Australia, Austria, Bangladesh, Belgium, Bermuda, Brazil, Bulgaria, Canada, Chile, China, Colombia, Congo, Costa Rica, Croatia (Local Name: Hrvatska), Cuba, Cyprus, Czech Republic, Denmark, Djibouti, Ecuador, Egypt, El Salvador, Estonia, Finland, France, Germany, Greece, Haiti, Hungary, Iceland, India, Indonesia, Iran (Islamic Republic Of), Ireland, Israel, Italy, Jamaica, Japan, Jordan, Kenya, Korea (Republic Of), Latvia, Lithuania, Luxembourg, Malaysia, Maldives, Malta, Mauritius, Mexico, Myanmar, Namibia, Netherlands, New Zealand, Norway, Oman, Pakistan, Panama, Papua New Guinea, Peru, Philippines, Poland, Portugal, Russian Federation, Senegal, Serbia, Seychelles, Singapore, Slovakia (Slovak Republic), Slovenia, South Africa, Spain, Sri Lanka, Sweden, Switzerland, Tanzania, United Republic Of, Thailand, Trinidad And Tobago, Turkey, United Arab Emirates, United Kingdom, United States, Uruguay, Vanuatu, Viet Nam

Based on operational platforms registered at JCOMMOPS as of June 2019: 86 countries

JCOMM takes this opportunity to thank all partners – WMO Members, IOC/UNESCO Member States and contributors for their continued support and encourages new partners to join the challenge of building a truly global ocean observing system that delivers the essential information needed for our sustainable development, safety, well-being and prosperity.

CONTACTS General information: www.jcomm.info Networks status: www.jcommops.org Assistance: reportcard@jcommops.org

If you wish to contribute to the global ocean observing system, please contact: JCOMM Observations Coordination Group (OCG) and Observations Programme Support centre (JCOMMOPS)

Conception : hippocampe.com • 4406009 • 06/2019 • © A. Hibbert/NOC, C. Van Zijl/University of Stellenbosch, F. Iain, L. Biddle/University of Gothenburg, NOAA’s Teacher at Sea Program, P. Castagno/Parthenope University, Sea Technology Services, Thinkstock